Monitor kubernetes cluster with Elastic Observability

Monitor Kubernetes cluster with Elastic

Introduction Bring logs, metrics, and traces from your Kubernetes cluster and the workloads running on it into a single, unified solution. Elastic observability gives better visibility on your kubernetes ecosystem where you can monitor your pods, services, workload etc. Use a centrally managed Elastic Agent to gain visibility into your Kubernetes deployments on EKS, AKS, GKE or self-managed clusters. Talk Video

July 28, 2023 · 1 min · Ashish Tiwari
arch linux main screen

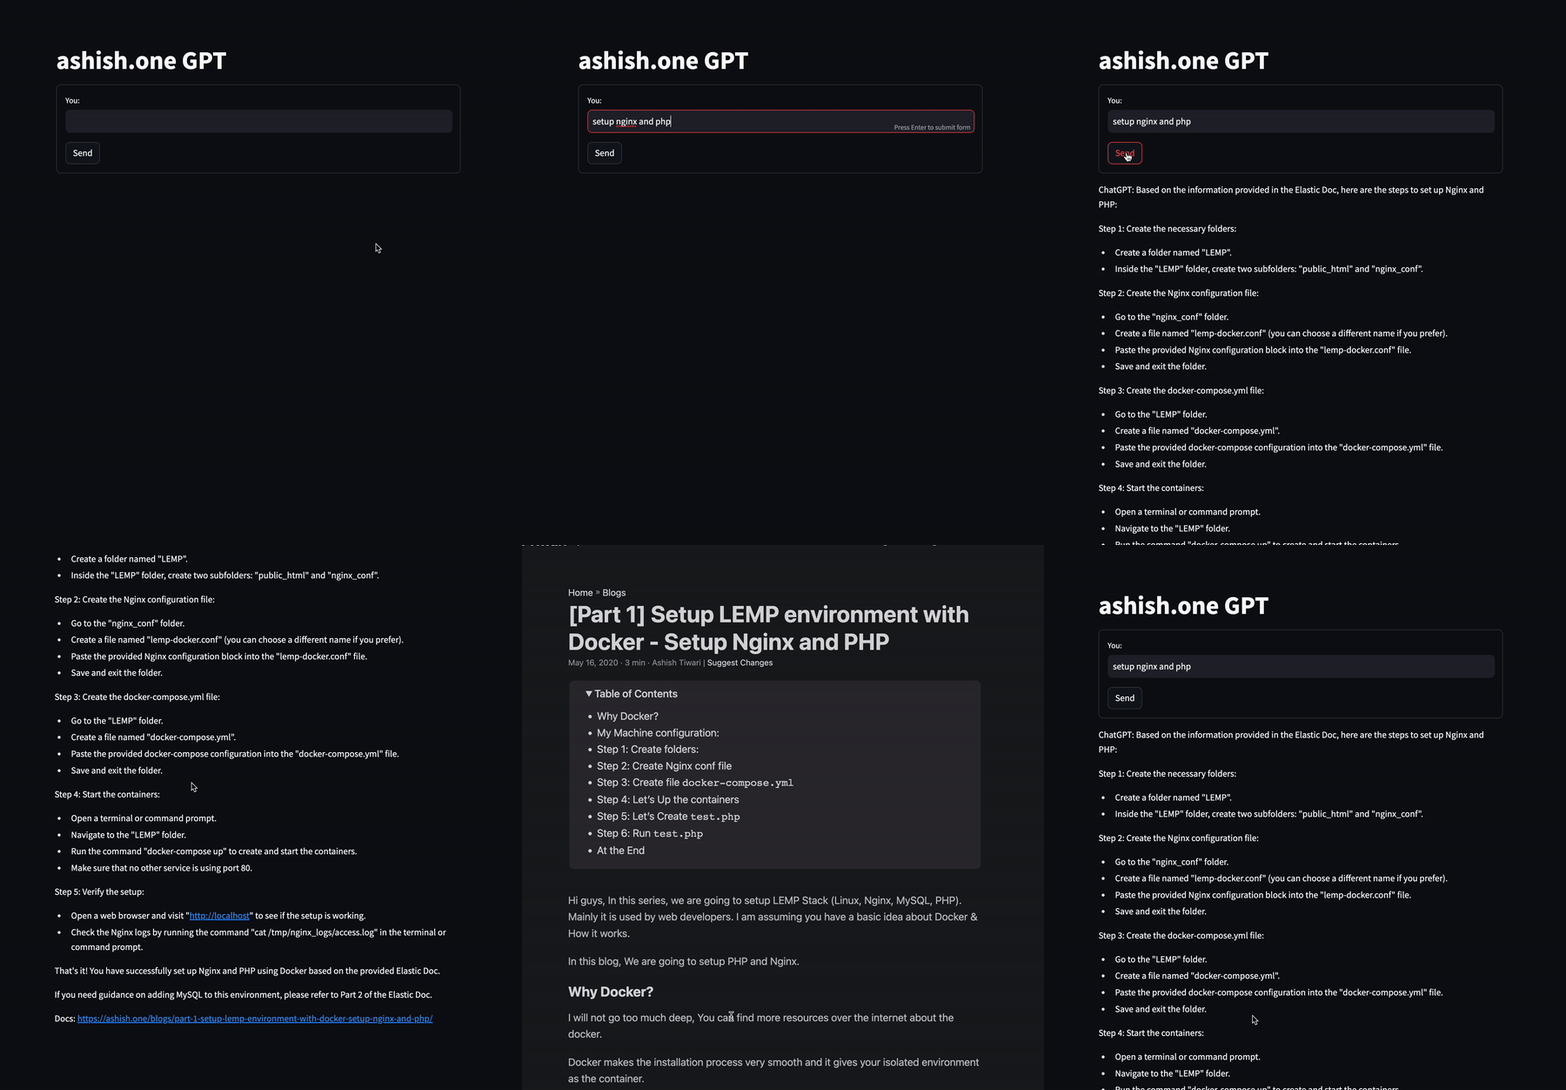
Workshop - Leverage ChatGPT with Elasticsearch

July 21, 2023 · 6 min · Ashish Tiwari
Virtual session on getting started with elastic stack

Getting started with Elastic stack

What this talk is all about ? Elastic Stack (Elasticsearch, Logstash, Kibana and Beats) is such a platform which is built for scalability, performance and “You know… for Search”. When you have a system which scales to the horizons of your data, helps you in your data quest, shows you insights - imagine what you can do with it. Talk Video Feel free to comment below, If you have any doubts or suggestion about this talk....

September 17, 2022 · 1 min · Ashish Tiwari

Getting started with Elasticsearch

Sample Queries for Elasticsearch Workshop CRUD # Insert POST meetup/_doc/ { "name":"Ashish Tiwari" } # Insert with id POST meetup/_doc/1 { "name":"Ashish Tiwari" } # Search GET meetup/_search # Update POST meetup/_doc/1 { "name":"Ashish", "company":"elastic", "address":"Navi Mumbai kharghar", "skills":{ "language":["php","java","node"], "database":["mysql","mongodb"], "search":"elasticsearch" } } # search with query GET meetup/_search { "query": { "match": { "address": "navi" } } } # delete DELETE meetup BULK POST _bulk {"index":{"_index":"meetup"}} {"user_id":1,"first_name":"Yvonne","last_name":"Willmott","email":"ywillmott0@live.com","gender":"Female","street_address":"38 Helena Avenue","ip_address":"104....

September 14, 2022 · 7 min · Ashish Tiwari
devops conf 2022 cover pic

Parse custom logs in Elasticsearch using grok_pattern

Introduction In the talk, Quickly showed how you can use the metricbeat to check system health. With a few clicks, you can start monitoring your infra. Another demo shows, How you can parse your custom unstructured logs to Elasticsearch. There is some utility already available for predefined logs format like json, apache, nginx and system logs etc. But if you have different requirement where you need to parse a different types of log format , You can parse using Grok processor ....

March 6, 2022 · 1 min · Ashish Tiwari