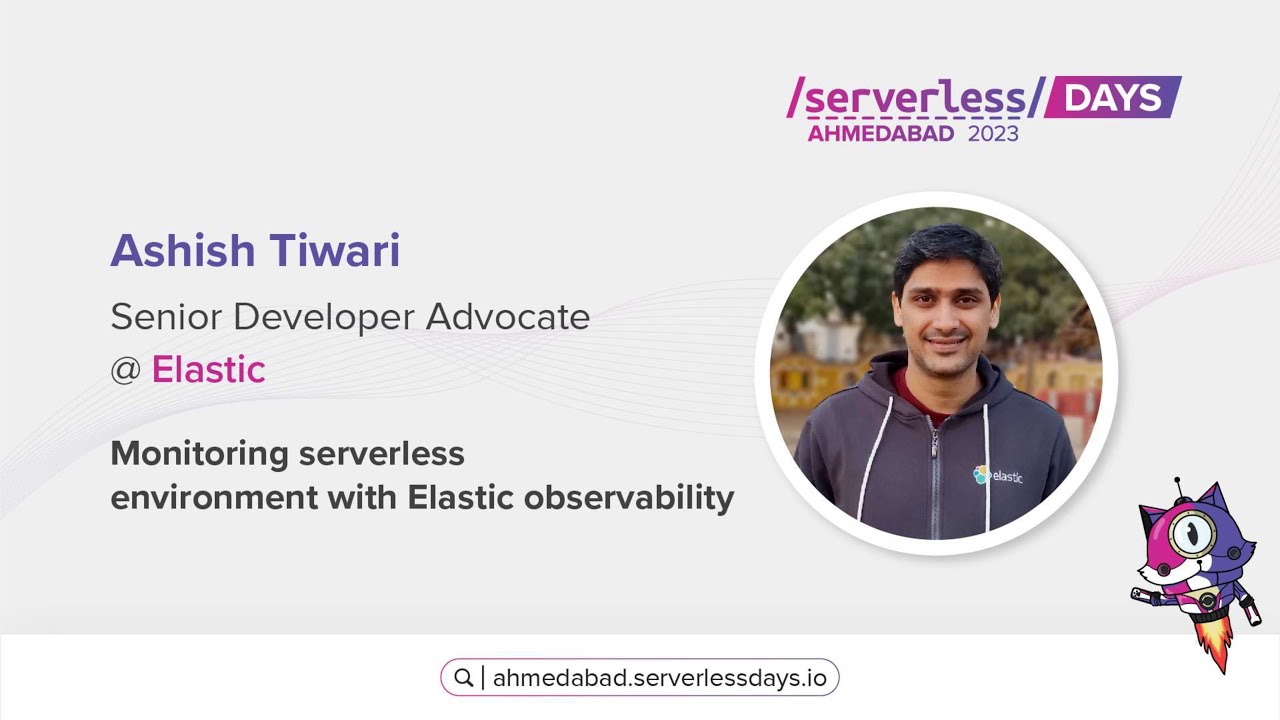
Serverless Ahmedabad 2023: Monitoring serverless environment with Elastic observability

Serverless Ahmedabad 2023: Monitoring serverless environment with Elastic observability

Introduction Serverless architectures take on-demand tasks to the next level with event-driven scheduling of workloads. Elastic Observability gives you the same insights into your serverless activities as the rest of your environment. Gather logs and metrics from your serverless invocations and tie them together with traces from your serverless functions. For example Identify AWS Lambda latency issues, cold starts, and other invocation issues. Logs are collected with the rest of your telemetry data, so you can look at all your data in context, in one place. ...


June 3, 2024 · 1 min · Ashish Tiwari

Setup & Observe Kubernetes cluster

Introduction In this gist we will quickly spin a sample Kubernetes cluster and deploying the nginx pod. Additionally, we will implement monitoring using Elastic. Setup K8s cluster Cluster architecture 3 Node cluster Machine - Centos7, 4GB RAM kube1.local - Control plane node kube2.local - worker node kube3.local - worker node Here I am setting hostname kube1.local, kube2.local, kube3.local. Login into all of the servers and perform below command on all three nodes. ...

March 28, 2024 · 3 min · Ashish Tiwari
Monitor kubernetes cluster with Elastic Observability

Monitor Kubernetes cluster with Elastic

Introduction Bring logs, metrics, and traces from your Kubernetes cluster and the workloads running on it into a single, unified solution. Elastic observability gives better visibility on your kubernetes ecosystem where you can monitor your pods, services, workload etc. Use a centrally managed Elastic Agent to gain visibility into your Kubernetes deployments on EKS, AKS, GKE or self-managed clusters. Talk Video

July 28, 2023 · 1 min · Ashish Tiwari
Virtual session on getting started with elastic stack

Getting started with Elastic stack

What this talk is all about ? Elastic Stack (Elasticsearch, Logstash, Kibana and Beats) is such a platform which is built for scalability, performance and “You know… for Search”. When you have a system which scales to the horizons of your data, helps you in your data quest, shows you insights - imagine what you can do with it. Talk Video Feel free to comment below, If you have any doubts or suggestion about this talk.

September 17, 2022 · 1 min · Ashish Tiwari
devops conf 2022 cover pic

Parse custom logs in Elasticsearch using grok_pattern

Introduction In the talk, Quickly showed how you can use the metricbeat to check system health. With a few clicks, you can start monitoring your infra. Another demo shows, How you can parse your custom unstructured logs to Elasticsearch. There is some utility already available for predefined logs format like json, apache, nginx and system logs etc. But if you have different requirement where you need to parse a different types of log format , You can parse using Grok processor. ...

March 6, 2022 · 1 min · Ashish Tiwari