Introduction
In PART-1 and PART-2, We have seen how prometheus works and how to setup Prometheus and exporters. We have readymade exporters available on the internet.
But sometime there is situation where you need to store your own custom metrics on prometheus. In such case you have to write your own exporters which will exporters the data into Prometheus.
There is two way to exporting the data on prometheus:
1. Exporting to a Pushgateway
Here we metrics are getting the push to prometheus server. It not exposed over any URL or port. Internally it directly calls to Prometheus host and pushes the metrics to that.
2. Exposing over HTTP (on specific port)
In this option, Exporter will expose all data over HTTP in prometheus data format. Like below:
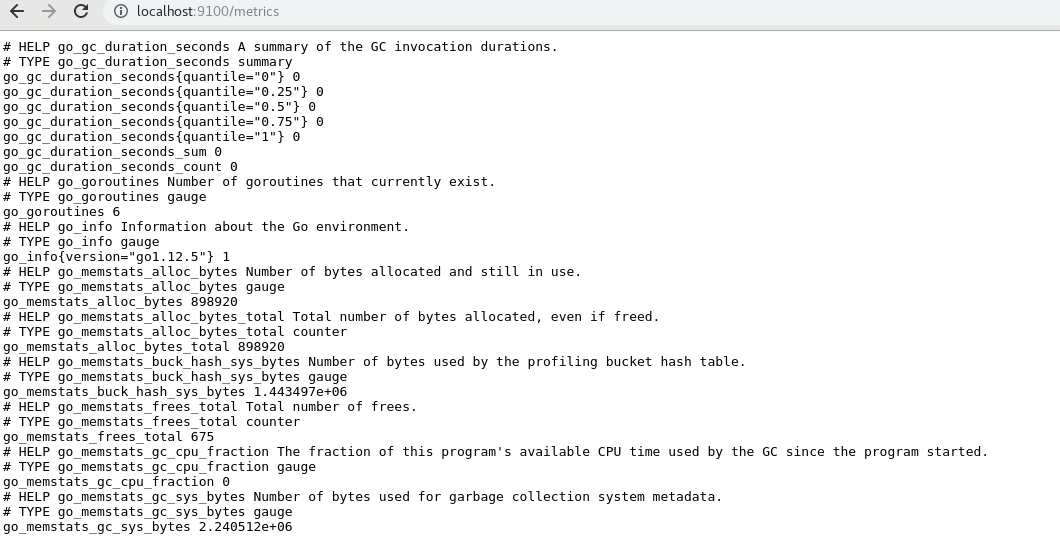
It exposes the data on a specific port e.g http://myurl:8000.
Basic Example
Let’s take a very basic example, Suppose there is one script (Daemon service) is running with the name myprocess.go. What do we do in real life to check if some script is running or not? We just hit ps command like below:
ps -ef | grep 'myprocess'
Now we are going to do the same in our exporter. It will hit the same command and if script is running we will set value 1 else 0.
Writing Exporter
We are going to use the Second option (Exposing over HTTP).
Step 1
We going to use python_client. Just install it with below pip command:
pip install prometheus_client
Step 2
We need webserver gateway, For which we are going to use WSGI.
Step 3
Whenever we are writing exporters, We need to take care of metric type storage. Prometheus offered four types of metrics: Counter, Gauge, Summary, and Histogram. You can explore more here. Decide your metric type before pushing data.
Step 4
We are going to run a webserver on 8000 port and exposing the result on /metrics path. So to access metrics just hit http://myurl.com:8000/metrics.
Step 5
Complet sample code from my gist:
Step 6
Add config in prometheus.yml
  - job_name: service_up_exporter
    scrape_interval: 2m
    scrape_timeout:  2m
    metrics_path: "/metrics"
    static_configs:
    - targets: ['exporterurl.com:8000/metrics']
Step 7
Restart prometheus service:
sudo service prometheus restart
This is just a very basic example. It is a simple script to understand the way of writing exporters. You can write your custom exporters according to your use case.
Here we have successfully write exporter which will expose the metrics. To know more about pushgateway or HTTP expoorter visit here
In part - 4, I have explained how you can integrate Grafana with Prometheus.
Share you comments below :)