Goal of this blog
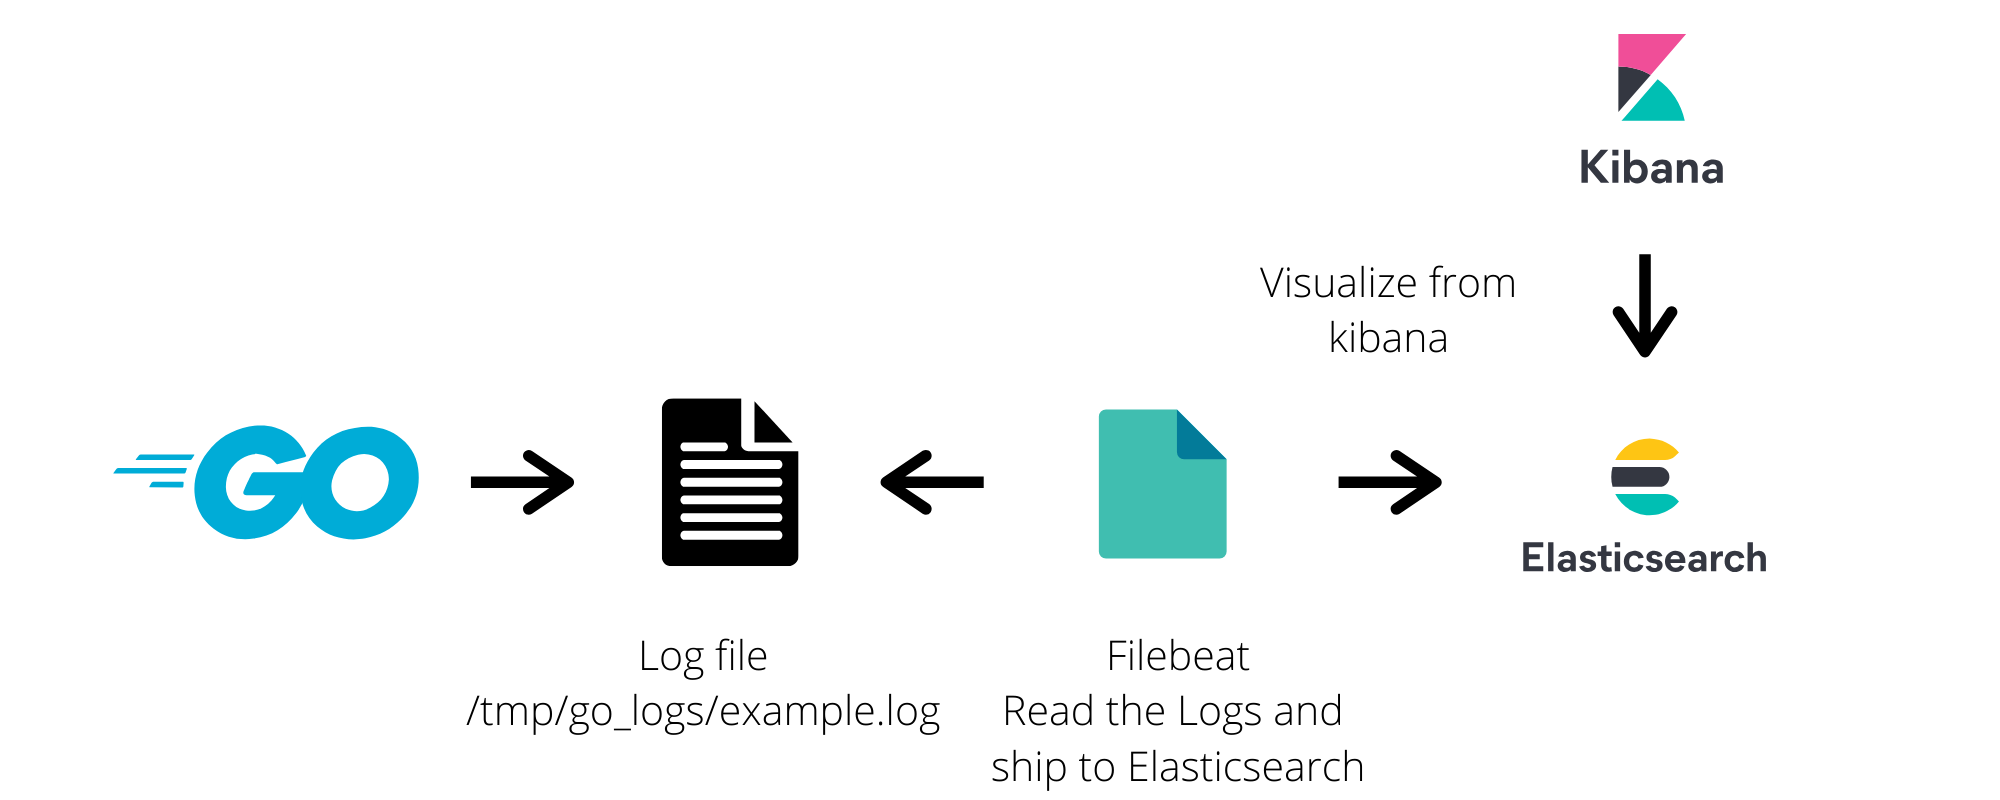
In this blog, I am going to show you how easily we can write logs to the files in Golang. As well as we are going to store all logs on elasticsearch with EKB (Elasticsearch, Kibana, Beats).
Why ELKB stack ?
Logs are very important for debugging, reporting, insights etc. In today’s tech world, We uses multiple cloud servers, private servers etc. Which consist of lots of different applications, scripts, programs, daemons, services and they generate their logs too. It is very difficult to go to each server and check all log files in case of debugging or to generate any insights or reporting.
In my case I used to go to every server and perform grep on log files.
ELKB Gives you an easy setup to move all yours logs into one central Place which is Elasticsearch & With a beautiful kibana interface, You can visualize all your logs. You can also make various types of dashboards.
This is a very small use case I am going to convert but you can find lots of big problem solving use cases on the internet about ELKB.
I will not go much deeper about ELKB stack. You can find a wonderful explanation on elastic.co.
Two Parts:
- Write JSON logs to the file in Go
- Shift All JSON logs on Elasticsearch
My Configuration
OS: ubuntu 18.04
Go version: go version go1.13 linux/amd64
Elasticsearch version: 7.7.1
Filebeat version: filebeat version 7.7.1 (amd64)
Kibana version: 7.7.1
1. Write JSON logs to the file in Go
I am assuming you have already installed Go on your machine. If not then you can refer to the installation guide here.
My Golang version:
go version go1.13 linux/amd64
Logrus
This is a wonderful package available to write logs. Below is the short example of using logrus package:
1. Install Logrus package
go install github.com/sirupsen/logru
2. Create log.go and paste the below code
package main

import (
  "os"
  log "github.com/sirupsen/logrus"
)

func init() {

  f, _ := os.OpenFile("/tmp/go_logs/example.log", os.O_RDWR|os.O_CREATE|os.O_APPEND, 0666)
  log.SetFormatter(&log.JSONFormatter{})
  log.SetOutput(f)

}

func main() {

  log.WithFields(log.Fields{
    "event": "create_profile",
    "user_id":   10,
  }).Info("This is an info message.")

  log.WithFields(log.Fields{
    "event": "delete_profile",
    "user_id": 11,
  }).Warn("This is a warning message.")

  log.WithFields(log.Fields{
		"event" : "edit_profile",
    "user_id": 13,
		"package" : "main",
  }).Fatal("This is a critical message.")

}
Here I have specified the log file /tmp/go_logs/example.log. You can specify according to your need. We also specified the log format JSON.
3. Lets run the log.go
$ go run log.go
4. Check log file:
$ cat /tmp/go_logs/example.log
Output
{"event":"create_profile","level":"info","msg":"This is an info message.","time":"2020-06-06T22:51:30+05:30","user_id":10}
{"event":"delete_profile","level":"warning","msg":"This is a warning message.","time":"2020-06-06T22:51:30+05:30","user_id":11}
{"event":"edit_profile","level":"fatal","msg":"This is a critical message.","package":"main","time":"2020-06-06T22:51:30+05:30","user_id":13}
Here I have used the log format JSON. Every log will be written in JSON format on the newline. You can check more features about logrus here.
2. Shift All JSON logs on Elasticsearch
This part has no dependency on the above part. You can use any JSON log file irrespective of any language.
Before start I am assuming you have installed Elasticsearch, Filebeat & Kibana on your machine. If not then refer below link:
Note: In this part we are not going to use Logstash.
1. Start Elasticsearch Service
$ service elasticsearch start
It will run on port 9200. You can verify with the below command or just hit localhost:9200 on your browser.
ashish@ashish-laptop:~$ curl localhost:9200

{
  "name" : "753853fa62d1",
  "cluster_name" : "docker-cluster",
  "cluster_uuid" : "JLlH0Z0pQqWjGEHO8MQgZQ",
  "version" : {
    "number" : "7.7.1",
    "build_flavor" : "default",
    "build_type" : "docker",
    "build_hash" : "ad56dce891c901a492bb1ee393f12dfff473a423",
    "build_date" : "2020-05-28T16:30:01.040088Z",
    "build_snapshot" : false,
    "lucene_version" : "8.5.1",
    "minimum_wire_compatibility_version" : "6.8.0",
    "minimum_index_compatibility_version" : "6.0.0-beta1"
  },
  "tagline" : "You Know, for Search"
}
2. Start Kibana service
$ service kibana start
It will run on port 5601. You can verify by visiting localhost:5601 from your browser. You should see the kibana dashboard.
3. Edit filebeat.yml
Open filebeat.yml. Add below snippet in filebeat.inputs:
filebeat.inputs:

- type: log
  enabled: true
  paths:
    - /tmp/go_logs/*.log
  json.add_error_key: true

output.elasticsearch:
  # Array of hosts to connect to.
  hosts: ["localhost:9200"]
You can check on below link to know more about filebeat log input & JSON decoding
https://www.elastic.co/guide/en/beats/filebeat/current/filebeat-input-log.html
4. Restart Filebeat
$ service filebeat restart
Verify If Data Indexed on Elasticsearch
Check Logs
$ tail -f /var/log/filebeat/filebeat
Check Indices:
$ curl localhost:9200/_cat/indices?v
Or you can simply visit localhost:9200/_cat/indices?v on your browser.
Output:
health status index                            uuid                   pri rep docs.count docs.deleted store.size pri.store.size
green  open   .apm-custom-link                 xp0mitnBQtijaZ9tEgan_g   1   0          0            0       208b           208b
green  open   .kibana_task_manager_1           7Q4mMTYxRhCB6sfnQ2ibmA   1   0          5            0       34kb           34kb
green  open   .apm-agent-configuration         3piA79spTbGWAVItYL3PlQ   1   0          0            0       208b           208b
yellow open   filebeat-7.7.1-2020.06.06-000001 nsFk7mOuTguIfaPSbeM3PA   1   1         19            0     74.9kb         74.9kb
green  open   .kibana_1                        LBmzoJspR8a8HAcs9WGr8g   1   0         54            0    171.6kb        171.6kb
As you can see a new index is created by filebeat with the name filebeat-7.7.1-2020.06.06-000001. In your case index name can be different but it will start with filebeat*.
Index lifecycle will be handled by filebeat. You don’t need to worry about that.
Check Documents
$ curl localhost:9200/filebeat-7.7.1-2020.06.06-000001/_search?pretty
Sample Output:
{
  "_index" : "filebeat-7.7.1-2020.06.06-000001",
  "_type" : "_doc",
  "_id" : "4qW3inIBVJJF9hMQm_yi",
  "_score" : 1.0,
  "_source" : {
    "@timestamp" : "2020-06-06T17:39:47.208Z",
    "log" : {
      "offset" : 0,
      "file" : {
        "path" : "/tmp/go_logs/ashish.log"
      }
    },
    "json" : {
      "msg" : "This is an info message.",
      "time" : "2020-06-06T23:09:26+05:30",
      "user_id" : 10,
      "event" : "create_profile",
      "level" : "info"
    },
    "input" : {
      "type" : "log"
    },
    "host" : {
      "name" : "ashish-laptop"
    },
    "agent" : {
      "version" : "7.7.1",
      "type" : "filebeat",
      "ephemeral_id" : "3f53f9c1-66a0-4e93-85fa-1532221c9670",
      "hostname" : "ashish-laptop",
      "id" : "72976284-d927-49d1-abcb-1d2a5be15176"
    },
    "ecs" : {
      "version" : "1.5.0"
    }
  }
}
Your data will be saved on the json key. Another is metadata which is added by filebeat. Filebeat provides lots of options, features & settings. You can use it according to your requirements.
Logs on Kibana
Visit on localhost:5601 from your browser. Create index pattern with the pattern filebeat*. Check here for more details.
Once you are done with defining the index pattern, Go to Discover section, Here you will see all your logs.
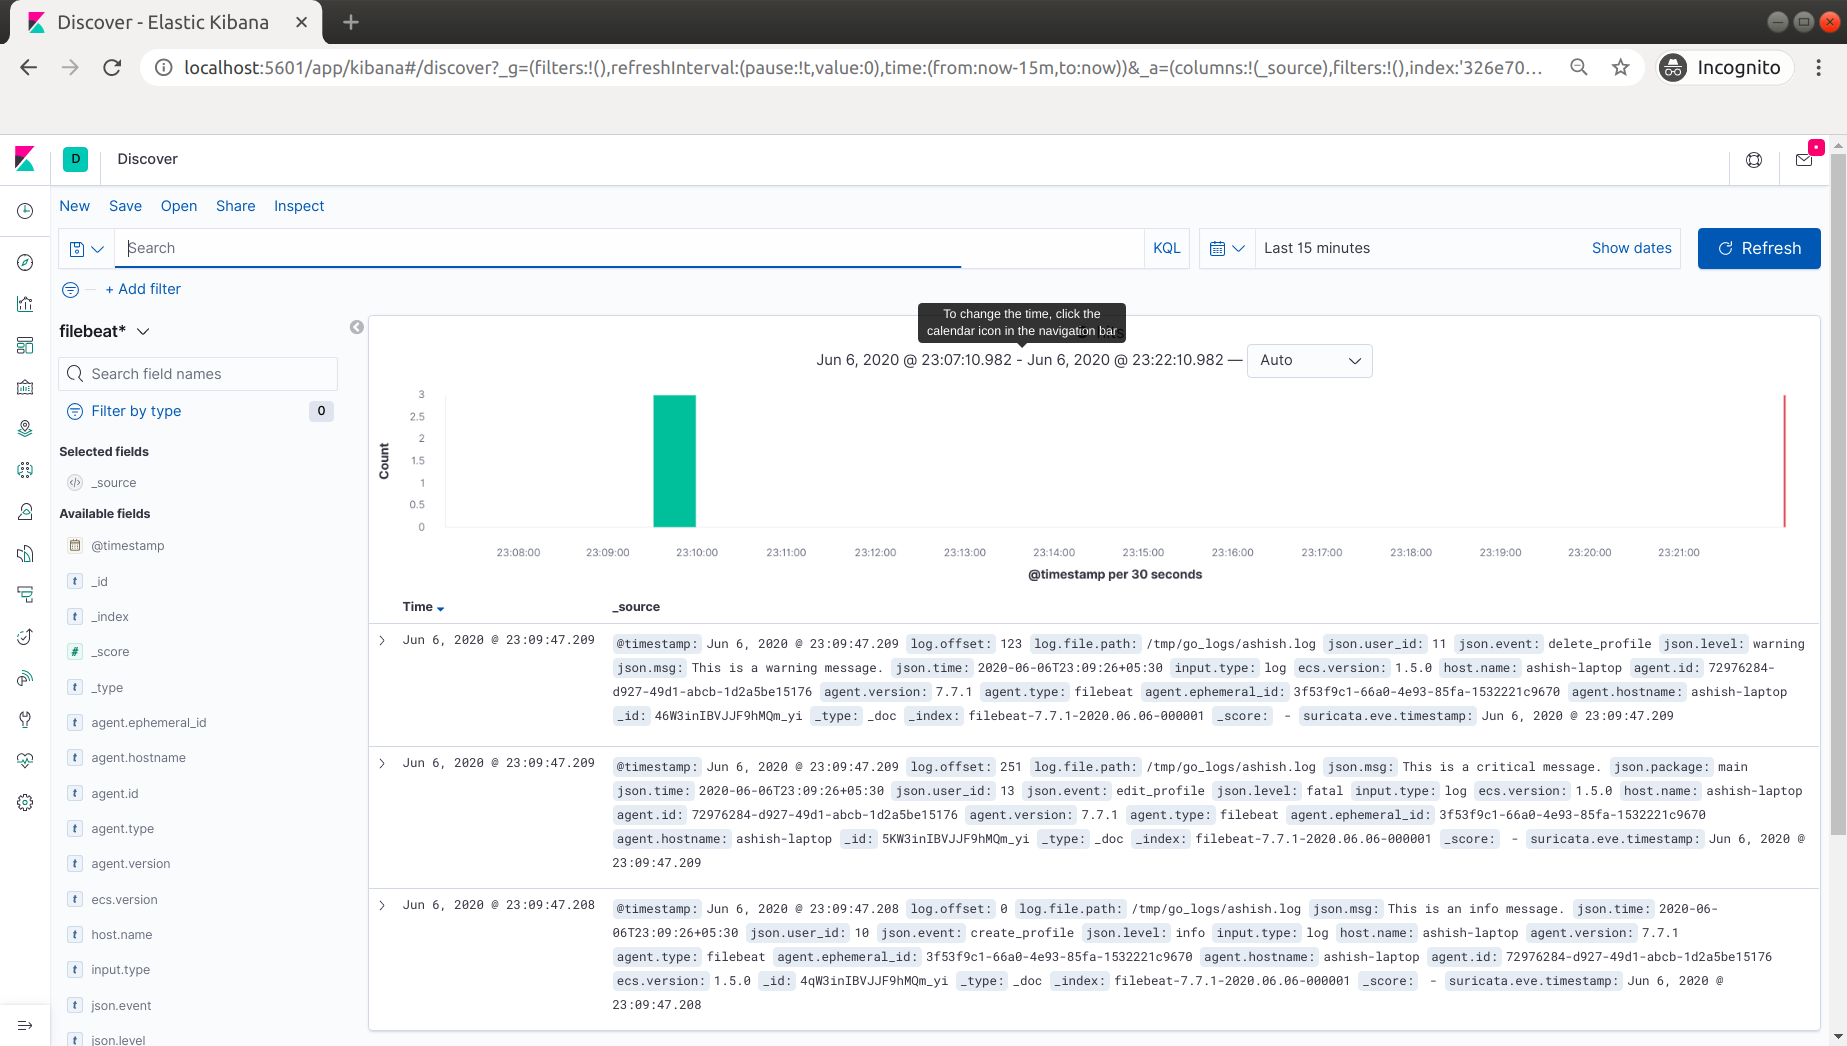
You can query on your logs. You can apply filters & create various types of dashboard to get better insights from your logs. You can find a wonderful explanation on the official site.
In the end
We have successfully shipped our logs on Elasticsearch. This is only a small use case of ELKB Stack. It provides much more than this. You can explore more on the internet.
Put your comments if you have any doubts.