As a developer, many times you would have worried, whether your services are up and running or not. Not only that, sometimes as an infrastructure guy you might be also worried about your server’s health too. What is the current RAM or disk utilization? or whether they are going to be fully occupied which in turn can completely bring the system down. These are just the basics and in fact there are tons of more such things which need to be monitored and fixed in everyday’s life.
“Never send a human to do a machine’s job”
At some time, deploying humans to check all these and that too for 24 * 7 can be a real pain.
That’s exactly the purpose of writing this tutorial series around monitoring and alerting. In this tutorial, you will learn how to setup Prometheus as a universal monitoring system and how to use its exporter to define and fetch the metrics which are really important to track.
What is Prometheus?
Prometheus is an open-source system for monitoring and alerting. It developed in the GO language. It is currently a standalone open source project and maintained independently by any organization. You can check more details here.
Why Prometheus?
- Open-source and of course freely available :)
- It is constantly contributed by the community. It is stable and used by many good brands. Check Stackshare.
- Good community support and well documented.
- You do not need any big infrastructure to get started. It can be started with 1 GB RAM.
- It has its own UI to check any metrics. But, many prefer Grafana with Prometheus which gives you better visualization on your Prometheus metrics.
- Lots of pre-build Grafana dashboard and exporters already written. You have to just reuse those exporters. You can check the list of Prometheus features here.
- You can check the list of Prometheus features here.
Prerequisites for setting up Prometheus
Here Is This Tutorial, Prometheus Is Installed And Tested On A Test Server With Minimum Configuration:
- 2 GB RAM
- 10 GB Avg local disk storage.
- GOLANG (go1.11.5 linux/amd64)
- Centos7 RHEL
Setup Prometheus
Installation
There are multiple ways to install Prometheus. You can use docker image or use any of the available configuration management systems like Ansible, chef, puppet and salt stack. For more information on installation, visit the official installation guide here.
It also has pre-compiled binaries available. I am going to use this binary for installation because it is easy to set up and easy to understand because of we already familiar with the utilization of binary files.
Step 1: Download the Prometheus binary
Visit Prometheus download page. It will give you a list of pre-compiled binaries for drawins, linux, and windows. You can download according to your OS. Below, the installation is explained for Linux OS.
OR
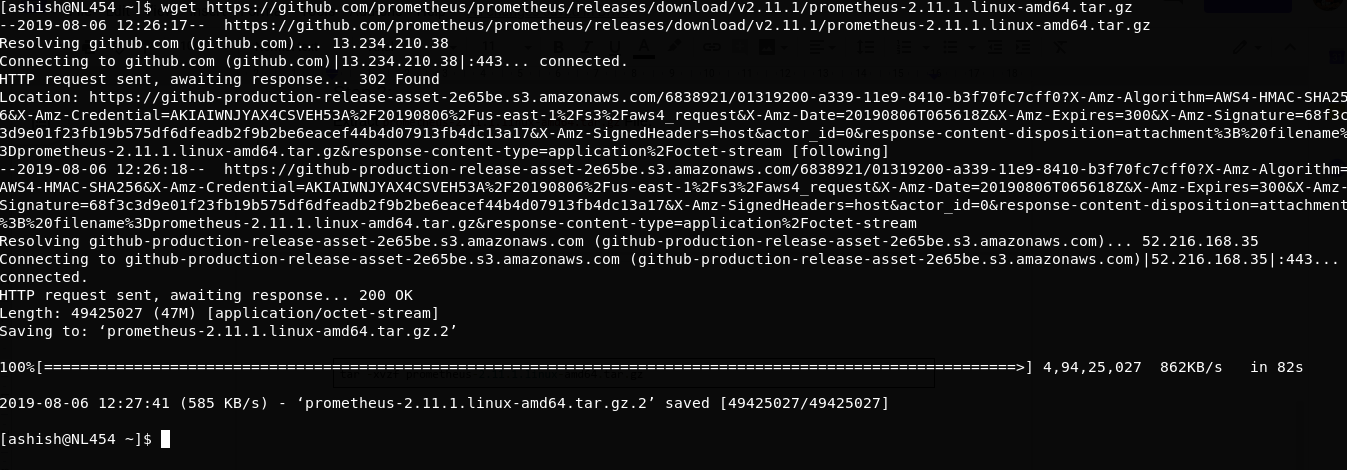
You can simply fire below command in your Linux terminal:
$ wget https://github.com/prometheus/prometheus/releases/download/v2.11.1/prometheus-2.11.1.linux-amd64.tar.gz
Step 2: Extract The Tar
$ tar -xvzf prometheus-2.11.1.linux-amd64.tar.gz
Step 3: After Extraction Steps
$ mv prometheus-2.11.1.linux-amd64 prometheus
$ cd prometheus/$ ll
Folder contains below file:
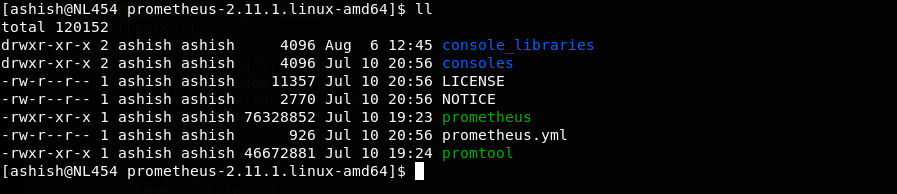
prometheus: It’s a binary file which is the core daemon.prometheus.yml: This is the config file for Prometheus service.promtool: This is another binary file which is used to compile the alert rules file. This will be explained in detail in the next series to this tutorial.
Step 4: Execute The Binary File Using The Below Command:
$ ./prometheus
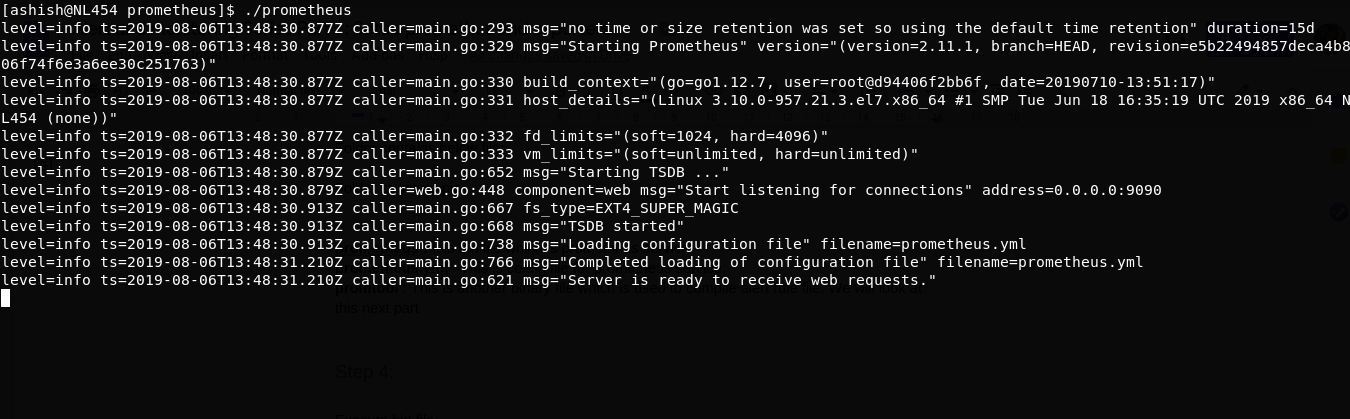
Visit localhost:9090 on your web browser:
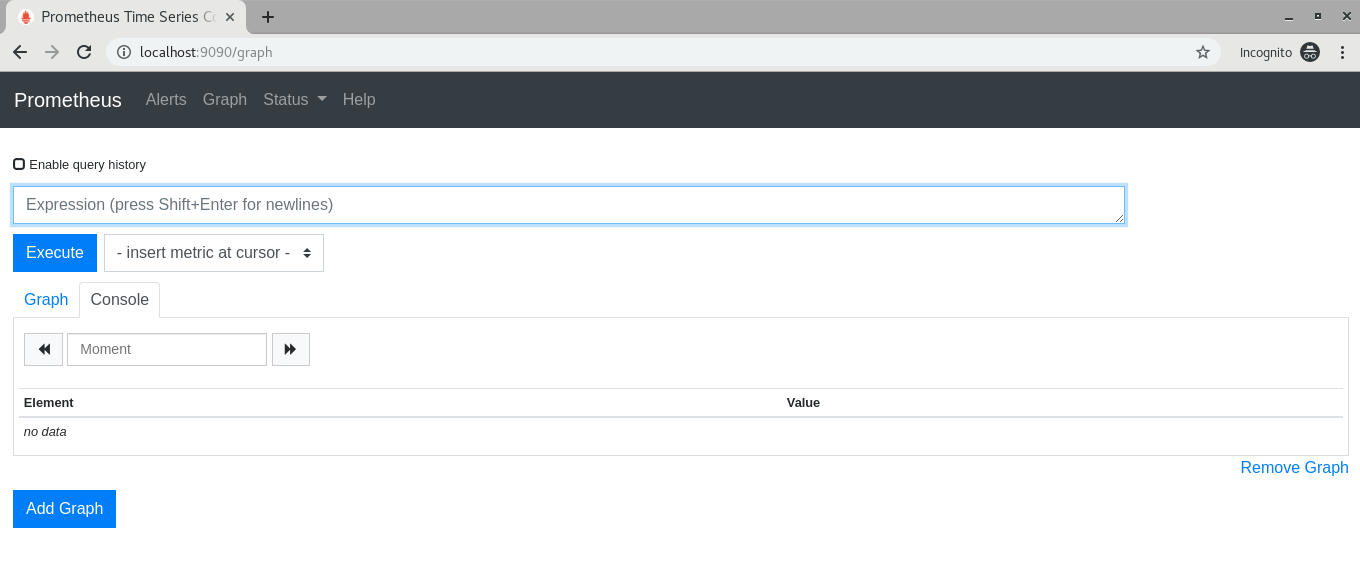
Your Prometheus is up and running!
If you notice in prometheus/ folder, It created a folder with the name data. Prometheus starts storing metrics in this /data folder only.
Now get all metric list by hitting the URL to localhost:9090/metrics
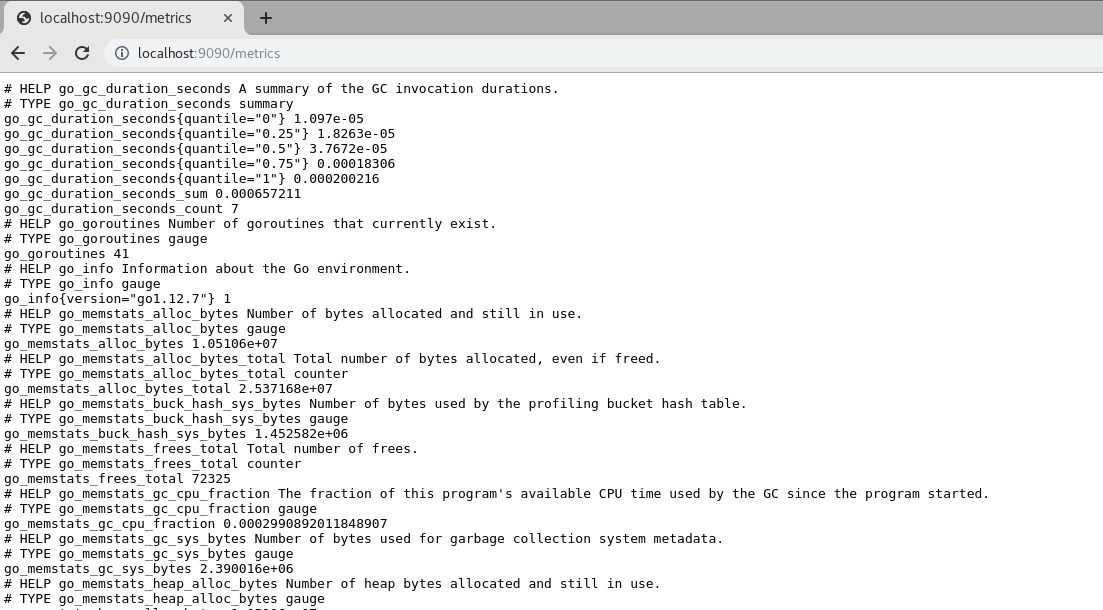
Prometheus stores data on disk in time series, with its custom format. Behind the scenes, it uses leveldb. You can check more details on storage.
Here is a sample production command:
$ ~/prometheus/prometheus --storage.tsdb.path=/var/lib/prometheus/data/ --web.external-url=http://myurl.com:9090
--storage.tsdb.path: Specify the path where you want to save Prometheus data.--web.external-url: You can use this option if you want to bind your address with your URL.
You can get below error in case of your folder don’t have appropriate permission:
level=error ts=2019-08-06T14:25:19.791Z caller=main.go:731 err="opening storage failed: lock DB directory: open /var/lib/lock: permission denied"
You can try appending sudo to your command OR you can give appropriate permission to your folder.
Step 5: Run Prometheus As Service.
- Create File
$ vim /etc/systemd/system/prometheus.service
- Just paste below code:
[Unit]
Description=Prometheus Server
Documentation=https://prometheus.io/docs/introduction/overview/
After=network-online.target

[Service]
User=root
Restart=on-failure

#Change this line if you download the
#Prometheus on different path user

ExecStart=~/prometheus/prometheus --storage.tsdb.path=/var/lib/prometheus/data/ --web.external-url=http://myurl.com:9090

[Install]
WantedBy=multi-user.target
Save and exit.
- Reload the Systemctl Daemon:
$ sudo systemctl daemon-reload
- Start the Prometheus service:
sudo systemctl start prometheus
Till now you learned how to do basic Prometheus setup. Now, you will learn, how to set up Prometheus exporter.
Prometheus Exporter Setup
What Is Exporter?
Exporters can be any scripts or services which will fetch specific metrics from your system and gives data in Prometheus format. There are primarily two ways by which you can fetch metrics and store into Prometheus:
Via exporter, In which one service will run on a specific port. So whenever Prometheus service will hit exporter URL with the specific port it will give output in Prometheus format. We will see sample response in the below example during setting up the node exporter.
The second approach is you can write a script which will push data in time series to the Prometheus server. Any metric which cannot be scrape by the exporter, It can be pushed using the push method. You will get more info here on this.
You can use both methods but usually, people prefer the first one to fetch metrics.
So now we are going to setup node exporter. It will fetch your server metrics which will be RAM/DISK/CPU utilization, network, io etc.
Node Exporter Setup
Step 1: Download The Binary File And Start Node Exporter:
$ wget https://github.com/prometheus/node_exporter/releases/download/v0.18.1/node_exporter-0.18.1.linux-amd64.tar.gz
$ tar -xvzf node_exporter-0.18.1.linux-amd64.tar.gz
$ mv node_exporter-0.18.1.linux-amd64 node_exporter
$ cd node_exporter
$ ./node_exporter
You should see below output once the node exporter is started:
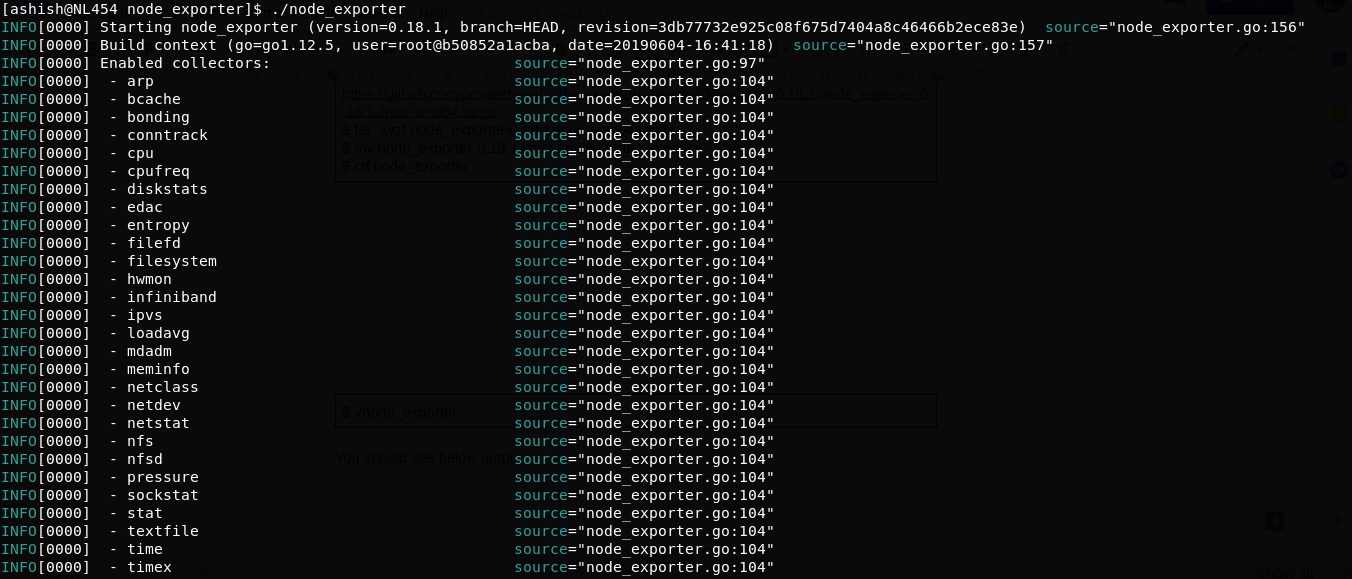
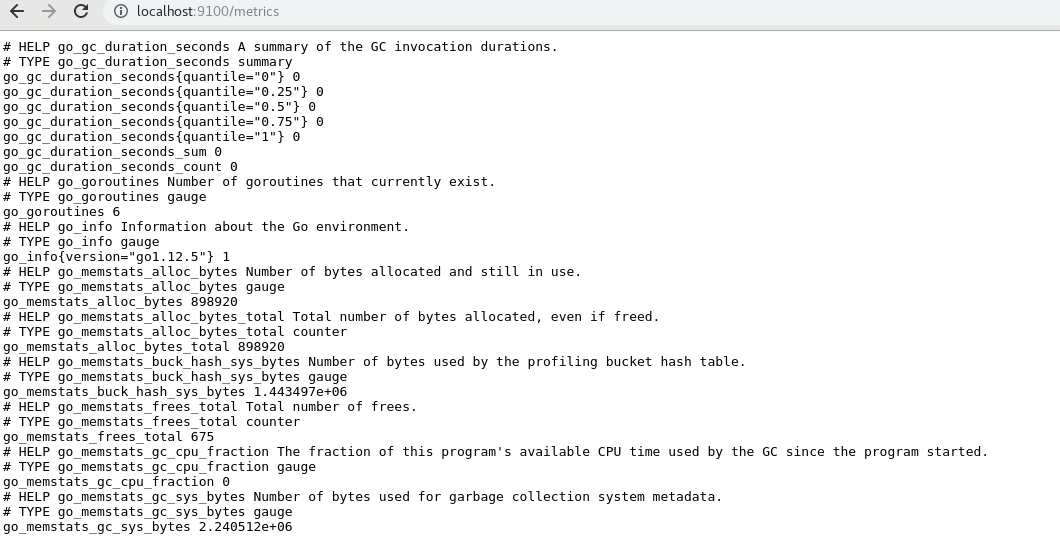
Just visit to localhost:9100/metrics
Step 2: Let’s Run Node Exporter As Service:
- Create a file in below path:
/etc/systemd/system/node-exporter.service
- Just paste below code:
[Unit]
Description=Node exporter
After=network-online.target

[Service]
User=root
Restart=on-failure

#Change this line if you download the
#Prometheus on different path user
ExecStart=~/node_exporter/node_exporter

[Install]
WantedBy=multi-user.target
- Reload the systemctl daemon:
sudo systemctl daemon-reload
- Start the Prometheus service:
sudo systemctl start node-exporter
Step 3: prometheus.yml
You Are Set With Node Exporter. Now In Prometheus, We Need To Configure This Node Exporter Reference So That Prometheus Can Collect Metrics From This Exporter.
Open file ~/prometheus/prometheus.yml add below configuration:
scrape_configs:
 # The job name is added as a label `job=<job_name>` to any timeseries scraped from this config.
 - job_name: 'prometheus'

# metrics_path defaults to '/metrics'
# scheme defaults to 'http'.
   static_configs:
   - targets: ['localhost:9090']
# Add below block for node_exporter
 - job_name: node_exporter
   scrape_interval: 1m
   scrape_timeout:  1m
   metrics_path: "/metrics"
   static_configs:
   - targets: ['localhost:9100']
Save and exit.
job_name: You can give any name to your scrape job.scrape_interval: Interval in which Prometheus will scrape the metrics from the specified URL.scrape_timeout: If your exporter has taken more than 1m to scrape the metrics it will be a timeout.metric_path: This is what your endpoint’s path should be (i.e localhost:9100/metrics)targets: Here you can specify the number of servers on which node exporter is running with the same configuration.
Step 4: Here’s The Command To Execute Prometheus:
~/prometheus/prometheus --storage.tsdb.path=/var/lib/prometheus/data/ --config.file=~/prometheus/prometheus.yml --web.external-url=http://myurl.com:9090
Also, don’t forget to make the same changes in your service file:/etc/systemd/system/prometheus.service
Step 5: Restart prometheus service
sudo systemctl restart prometheus
Step 6: Visiting Localhost:9090 Again
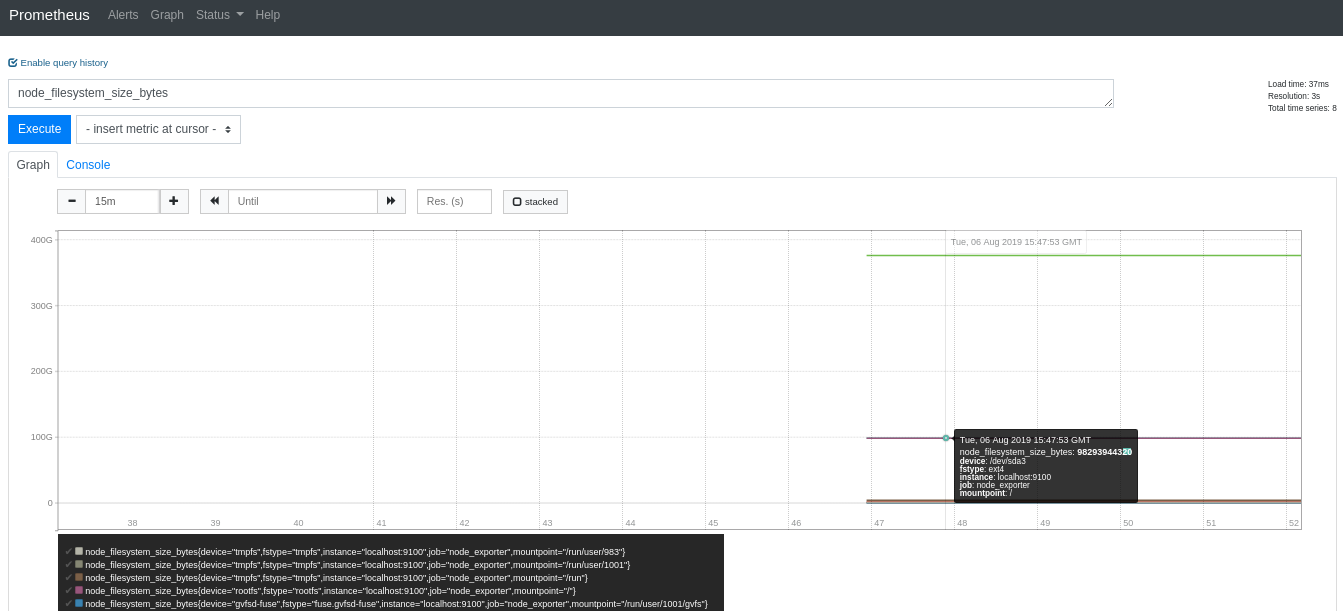
Now visit the URL localhost:9090. In Expression field you can search for node_filesystem_size_bytes by clicking on the Execute button. You will get the below stats:
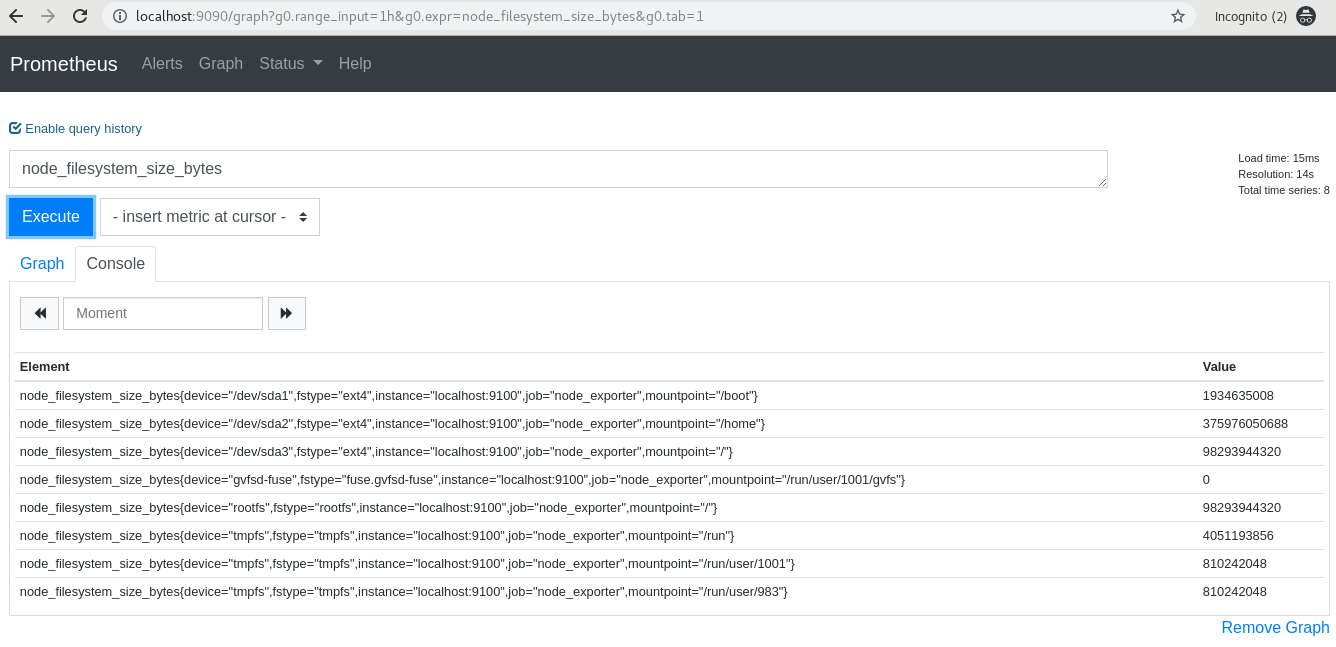
After clicking on the graph:
Installation with Docker
Prometheus
docker run \
    -p 9090:9090 \
    -v ~/prometheus/prometheus.yml:/etc/prometheus/prometheus.yml \
    prom/prometheus
Node Exporter
docker run -d \
  --net="host" \
  --pid="host" \
  -v "/:/host:ro,rslave" \
  quay.io/prometheus/node-exporter \
  --path.rootfs=/host
The rest of option will remain same as i explained in above parts.
At the end
Like this, you can explore each metrics like memory, CPU, etc.
There are already lots of exporters is available on the internet like Nginx exporter, MongoDB exporter, MySQL server exporter, etc. Just download them and start using it. You can check more info about exporter here.
You have now successfully installed Prometheus and node exporters.
If you see this official architecture diagram, we have successfully set up the Prometheus, Pushgateway/Exporters, and Prometheus UI.
In the Part 2, we will see how we can set up an alert manager and how to setup alert over the metrics.
Stay tuned for the new updates.
“NOTE: PROMETHEUS IS METRIC STORAGE SYSTEM. DON’T TRY TO STORE ANY KIND OF LOGS. IT IS NOT RECOMMENDED.”
In case of any confusion or issues leave comments below :)
Article partially posted on Pepipost tutorial by me.