As you know Prometheus already having UI (localhost:9090). But it is not enough to give you better visualization on one screen. For better visualization and a graphical representation, we are going to use Grafana.
What is Grafana?
As grafana.com says
”Grafana is the open-source analytics and monitoring solution for every database.”
This means Grafana is an independent tool for analytics and monitor which gives your various types of Graphs. It is not restricted to Prometheus DB only, You can use mostly any Databases like MySQL, Elasticsearch, etc. So you can visualize different data points from the different databases on one screen. This is the flexibility and power Grafana provides.
Grafana works on TSDB(Time Series Database) or Your data should be save in time series manner. Check explaination here.
It has an alert system. You can configure an alert on Grafana itself for any Metric.
Why Grafana?
- Open-source of course freely Available
- It is constantly contributed by the community. It is stable and used by many good brands.
- Good community support and well documented.
- You do not need any big infrastructure to get started.
- Lots of pre-build Grafana dashboards already available and build by the community. So it will be a rare case where you have to build your dashboard.
My local system configuration:
- 8GB RAM
- Ubuntu 18.04 LTS
You can check here your system requirement according to your Operating System. Also, They explained different ways to install Grafana for different OS.
Setup Grafana
Installation
Grafana has two types of Software:
- Enterprise Release
- Open-Sources Software(OSS) or Community Release
We are going to install OSS Release.
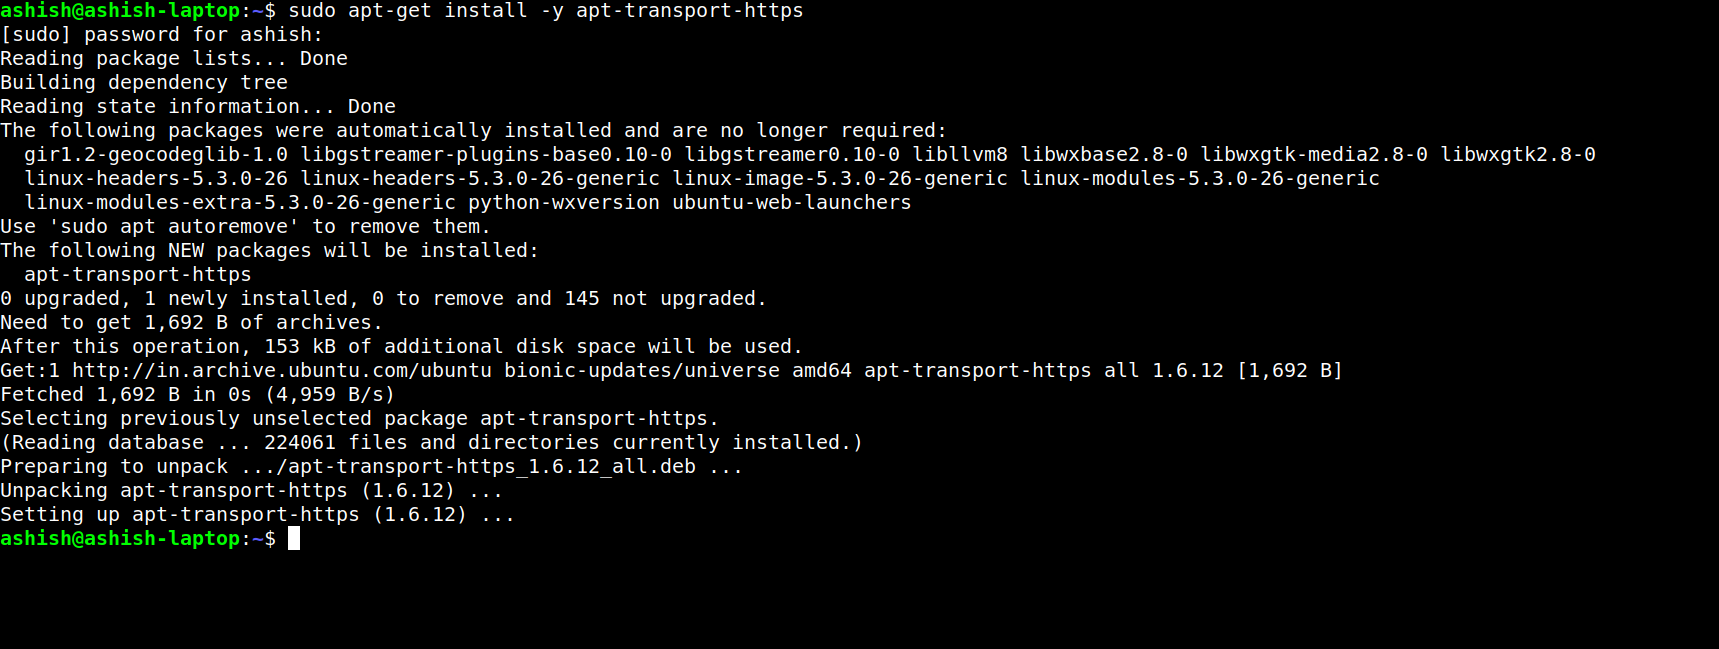
Step 1: Install apt-transport-https
$ sudo apt-get install -y apt-transport-https
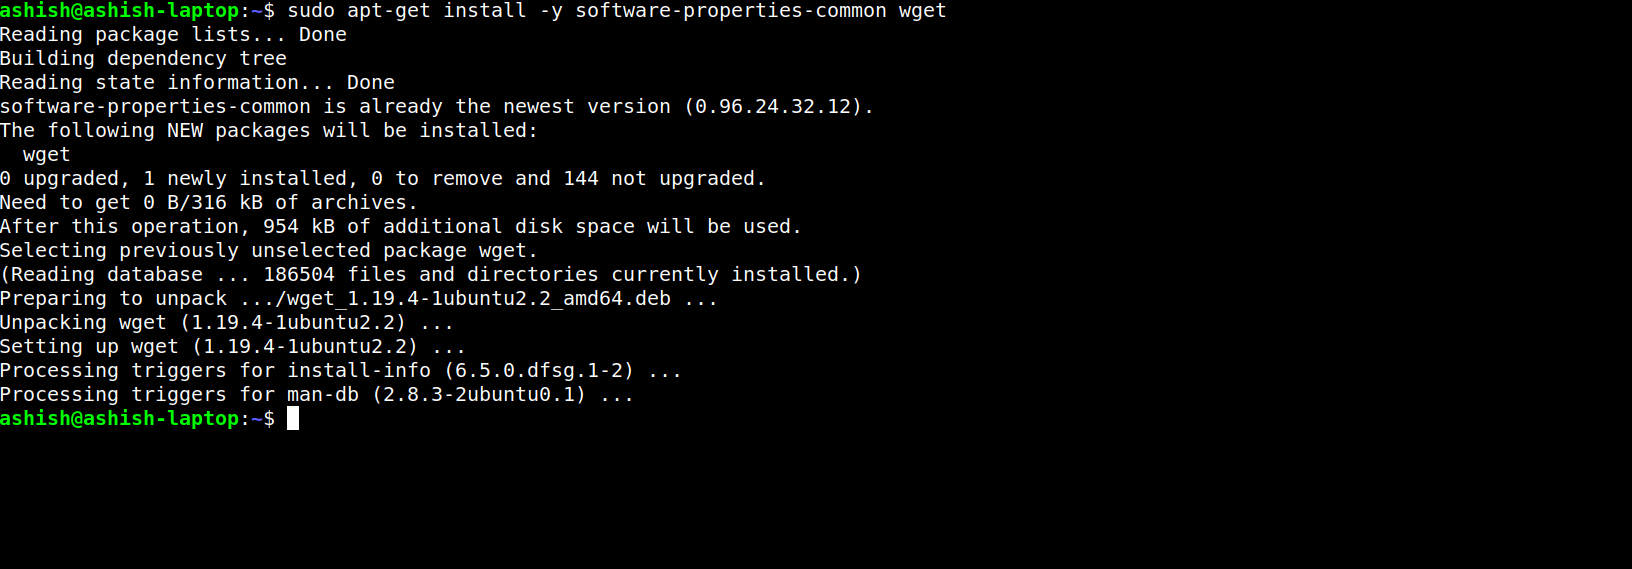
Step 2: Install wget
$ sudo apt-get install -y software-properties-common wget
Step 3: Add key
$ wget -q -O - https://packages.grafana.com/gpg.key | sudo apt-key add -
Step 4: Add apt Repository
$ sudo add-apt-repository "deb https://packages.grafana.com/oss/deb stable main"
OK
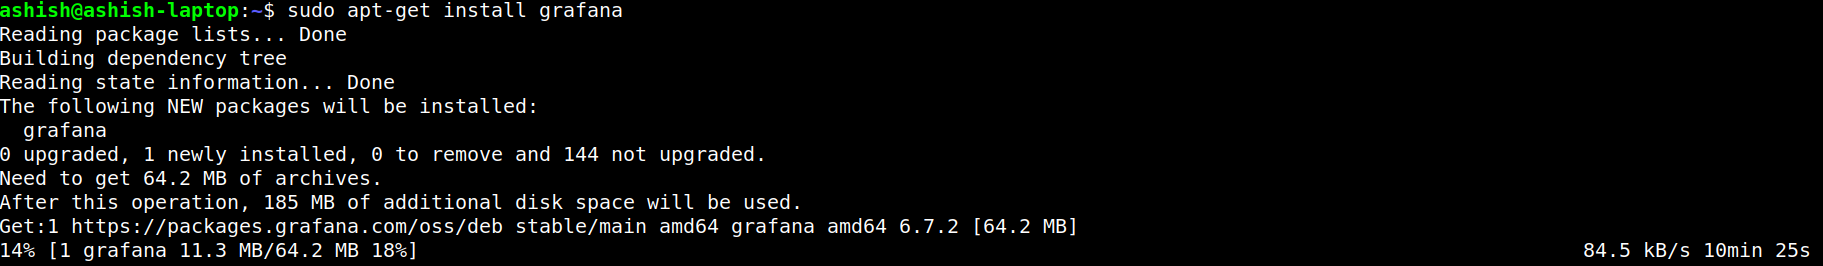
Step 5: Update & Install
$ sudo apt-get update
$ sudo apt-get install grafana
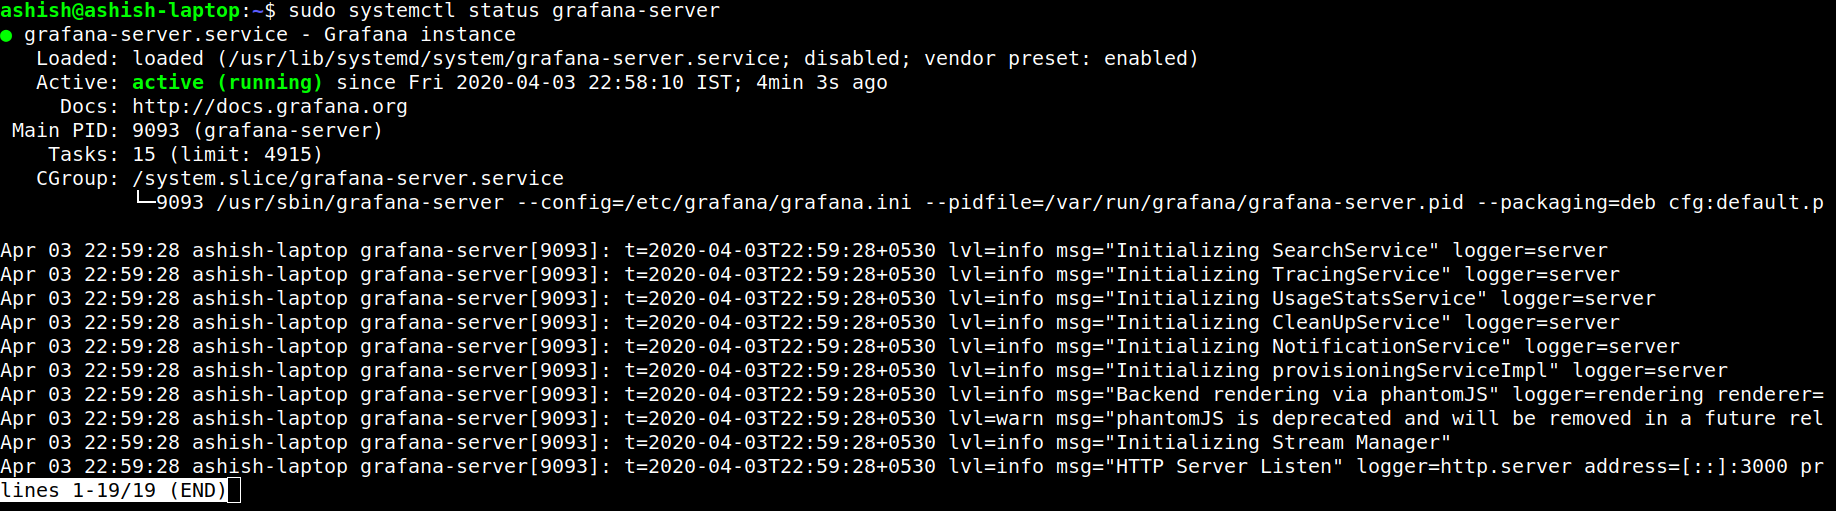
Step 6: Start grafana-server
$ sudo systemctl daemon-reload
$ sudo systemctl start grafana-server
$ sudo systemctl status grafana-server
Step 7: Visit localhost:3000
Install with Docker
Ignore this part if you not using docker.
docker run -d -p 3000:3000 grafana/grafana
visit localhost:3000.
We have successfully installed Grafana. Let’s configure with Prometheus.
Configure with Prometheus
We already setup Prometheus in part 1. Now I am considering your Prometheus and Node exporter are running on port 9090 & 9100 respectively.
Setup Grafana <–> Prometheus
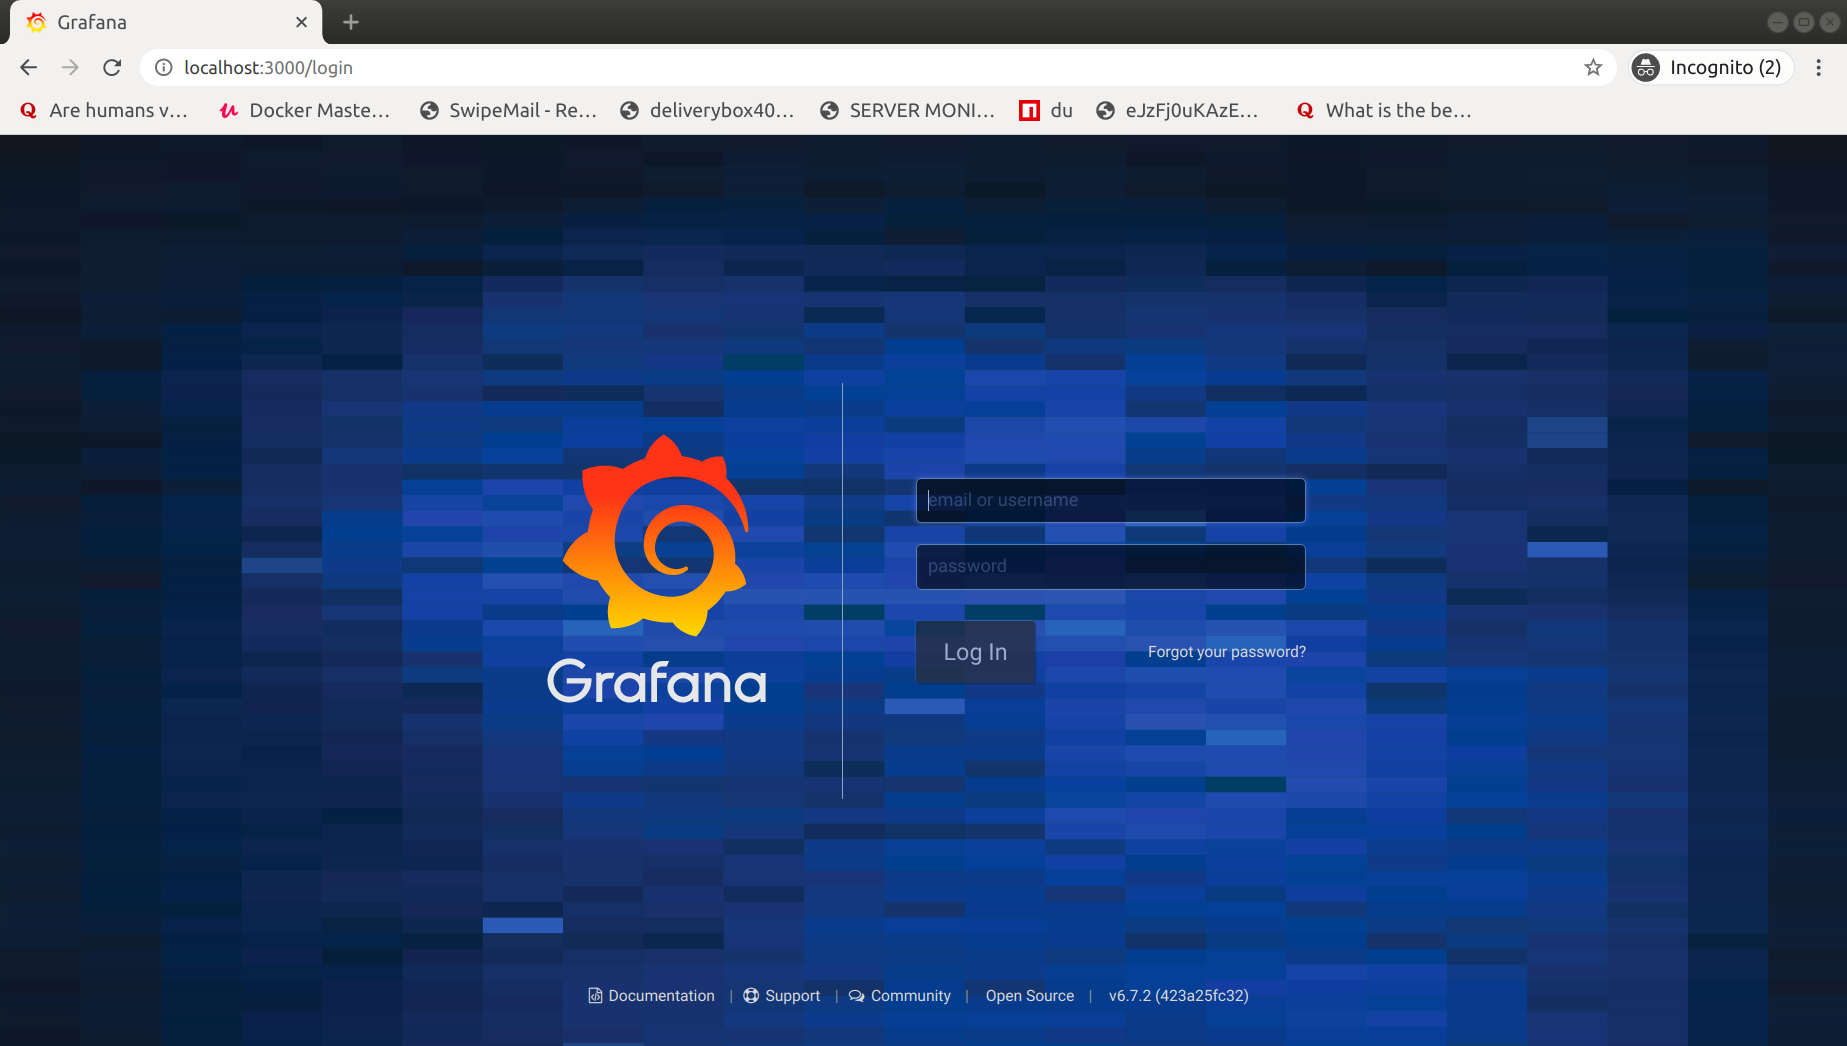
Step 1: Login on Grafana
Visit localhost:3000. 3000 is the default port of Grafana, However, you can run on any port. To change the port see the configuration.
Login into Grafana with default Credentials:
Username:admin
Password:admin
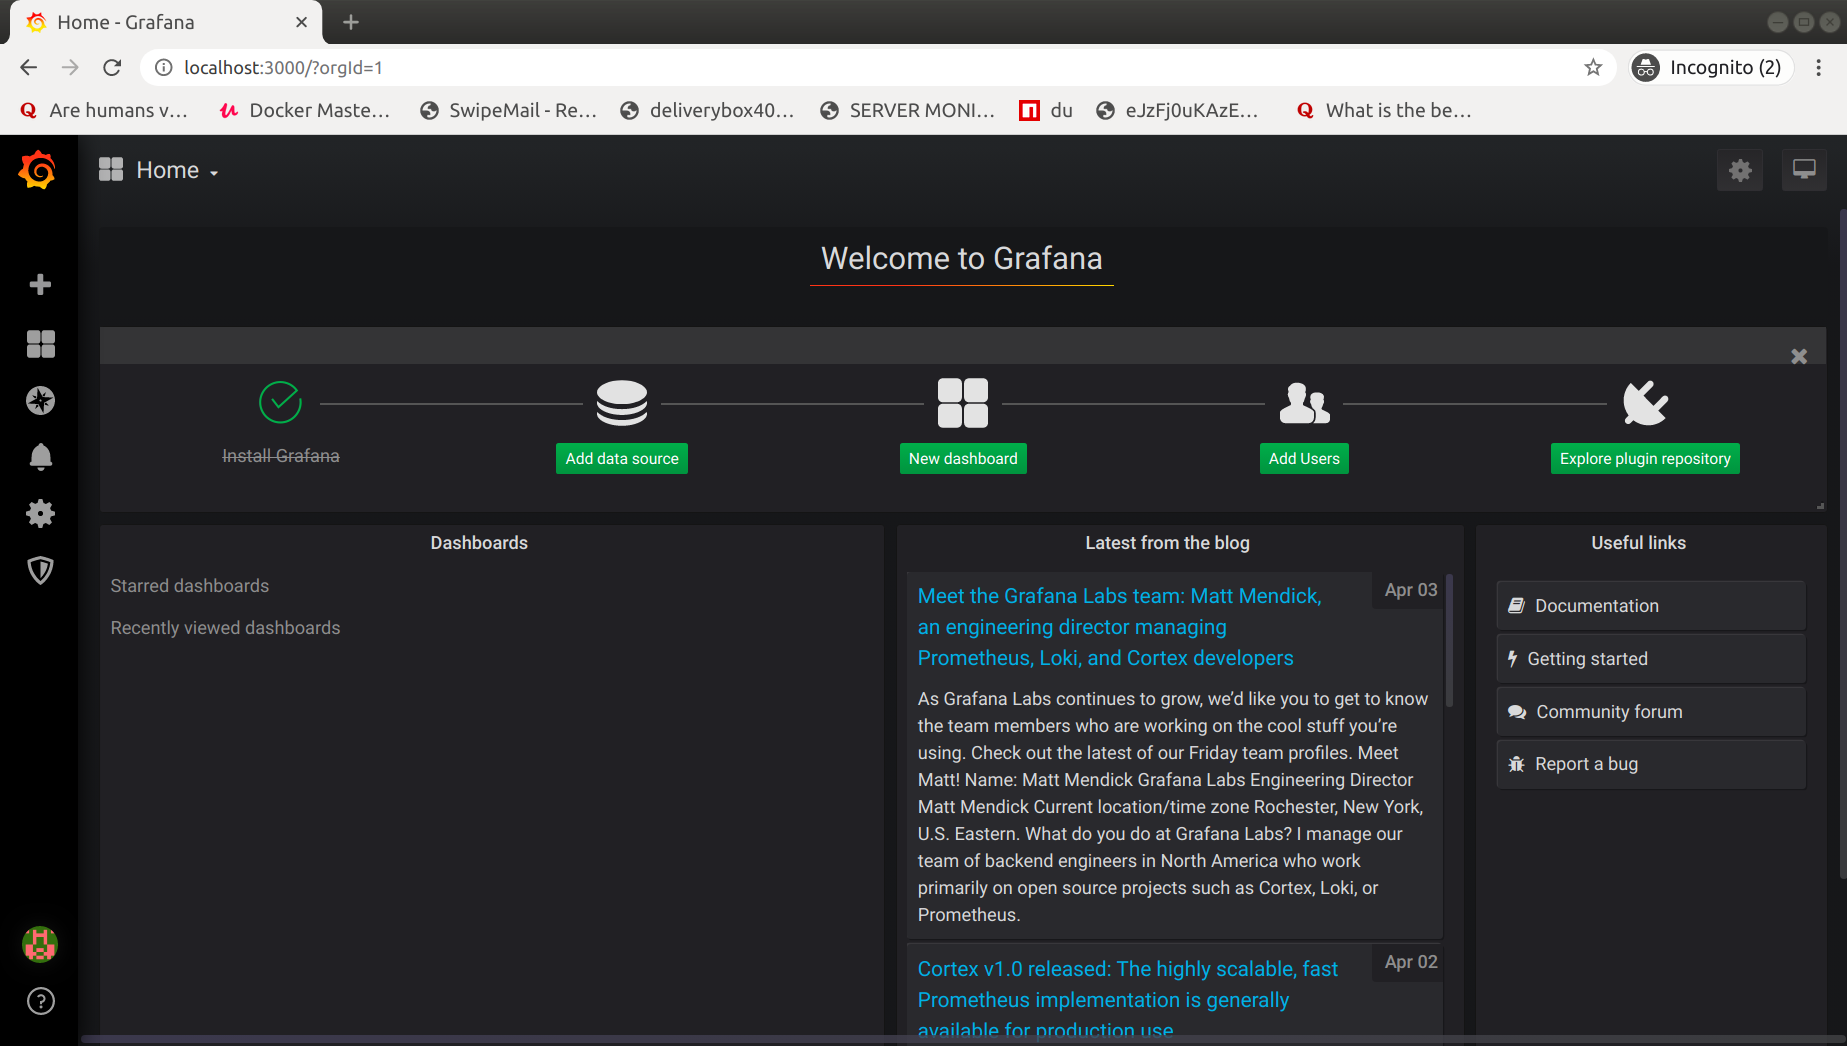
Now it will ask you to change your password. Once done, Click on save, You will be redirect on the dashboard.
Step 2: Add Data Source
Goto Sidebar & Navigate:
Configuration -> Data Sources
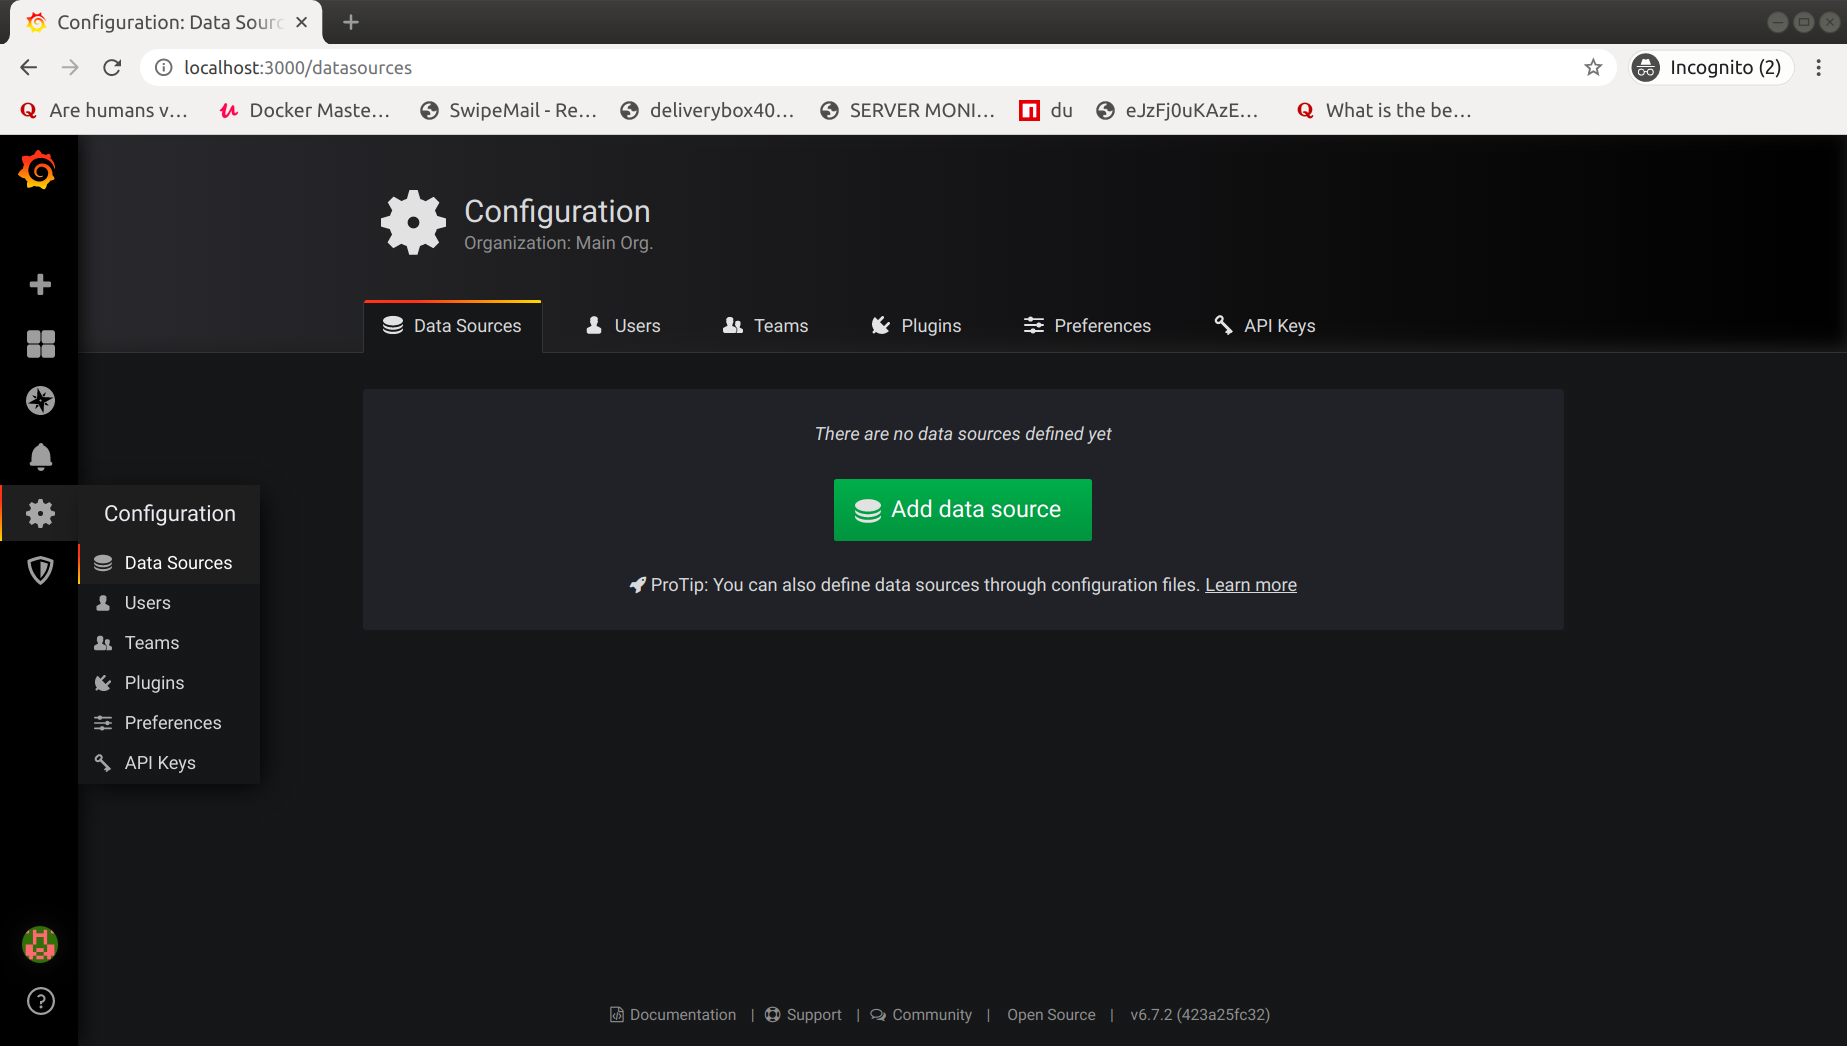
click on Add data source.
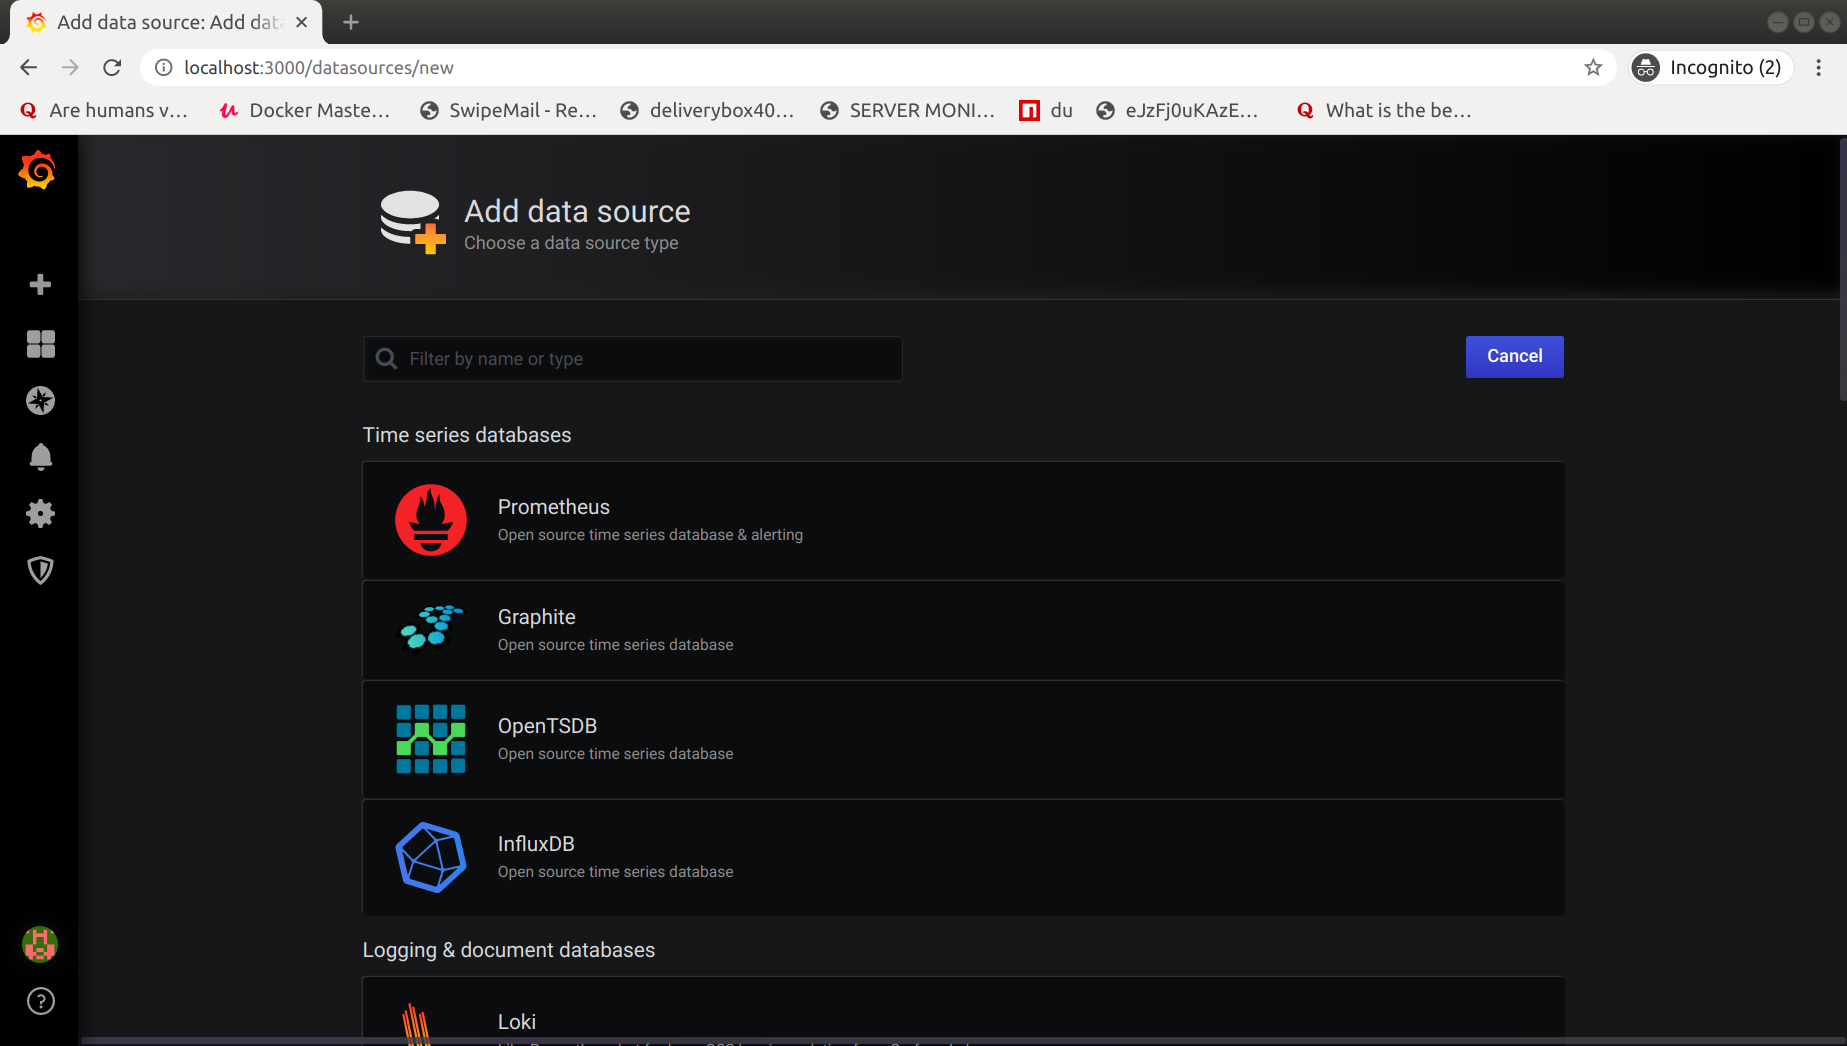
Search for Prometheus & click on Select.
Add Prometheus endpoint in URL and click on save & Test.
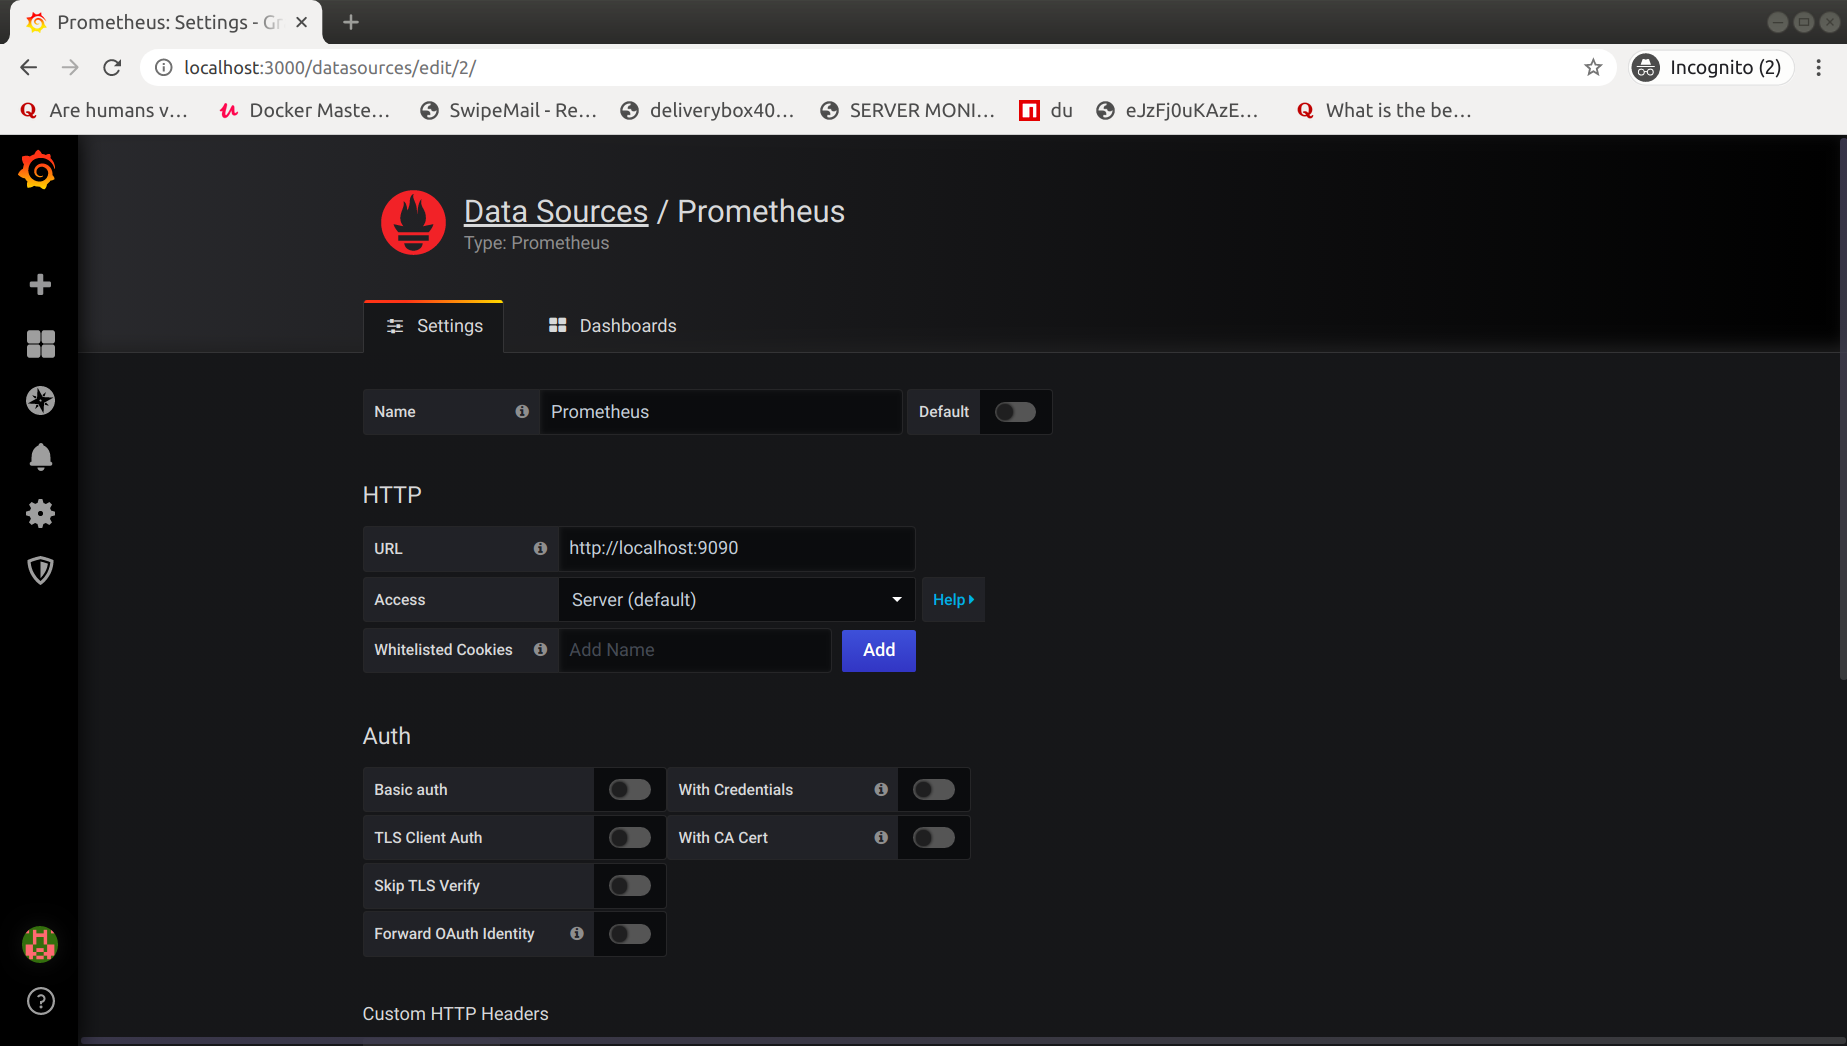
You will get the notification for success. Here we have successfully integrated Grafana and Prometheus.
Step 3: Add Dashboard
Here we have two option available:
- Create your Dashboard
- Import any pre-build Dashboard
We will go with the second option because that is the beauty of community :) People already build a dashboard for various stacks.
You can search for Dashboard from https://grafana.com/grafana/dashboards as per your requirement.
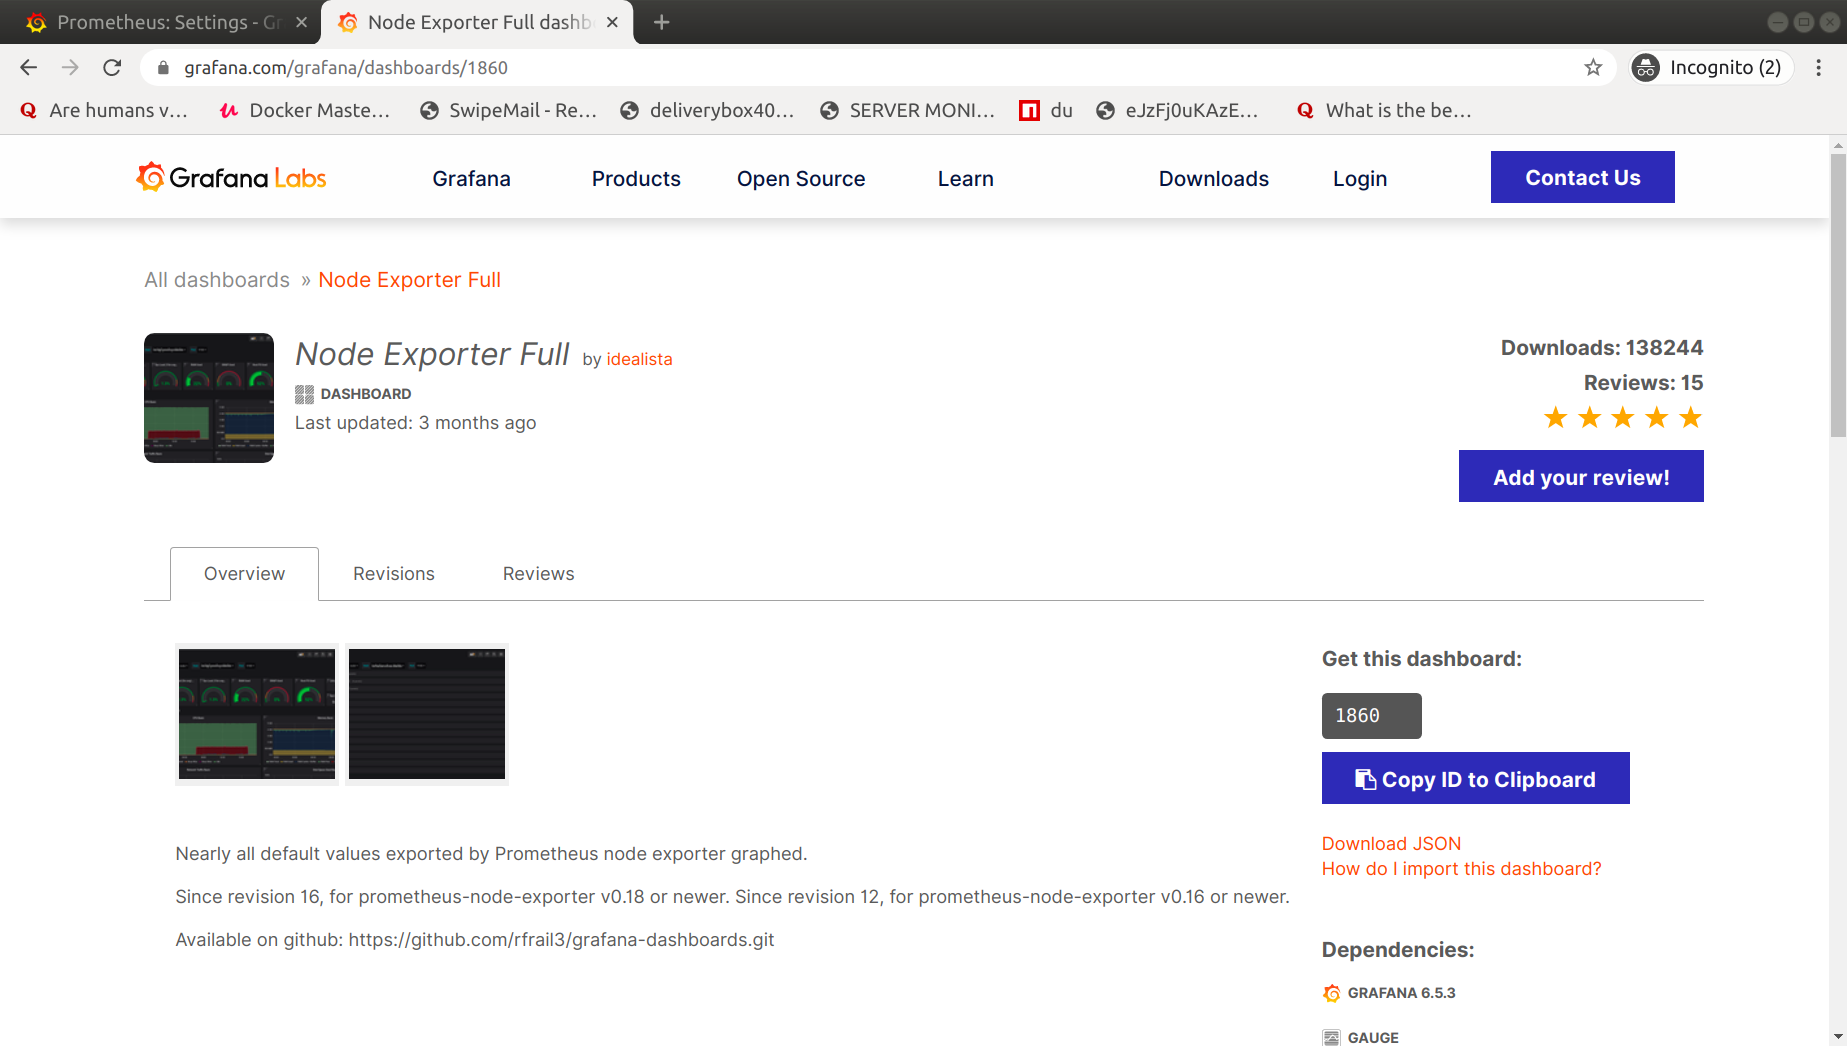
Here is the link for Node exporter dashboard: https://grafana.com/grafana/dashboards/1860
Here Dashboard ID is 1860. Every dashboard which contributed in Grafana has unique ID. You can just import any dashboard by inserting the ID.
On Grafana Goto sidebar & Navigate:
+(Plus/Add sign) -> Import
Enter Dashboard Id and click on load. After that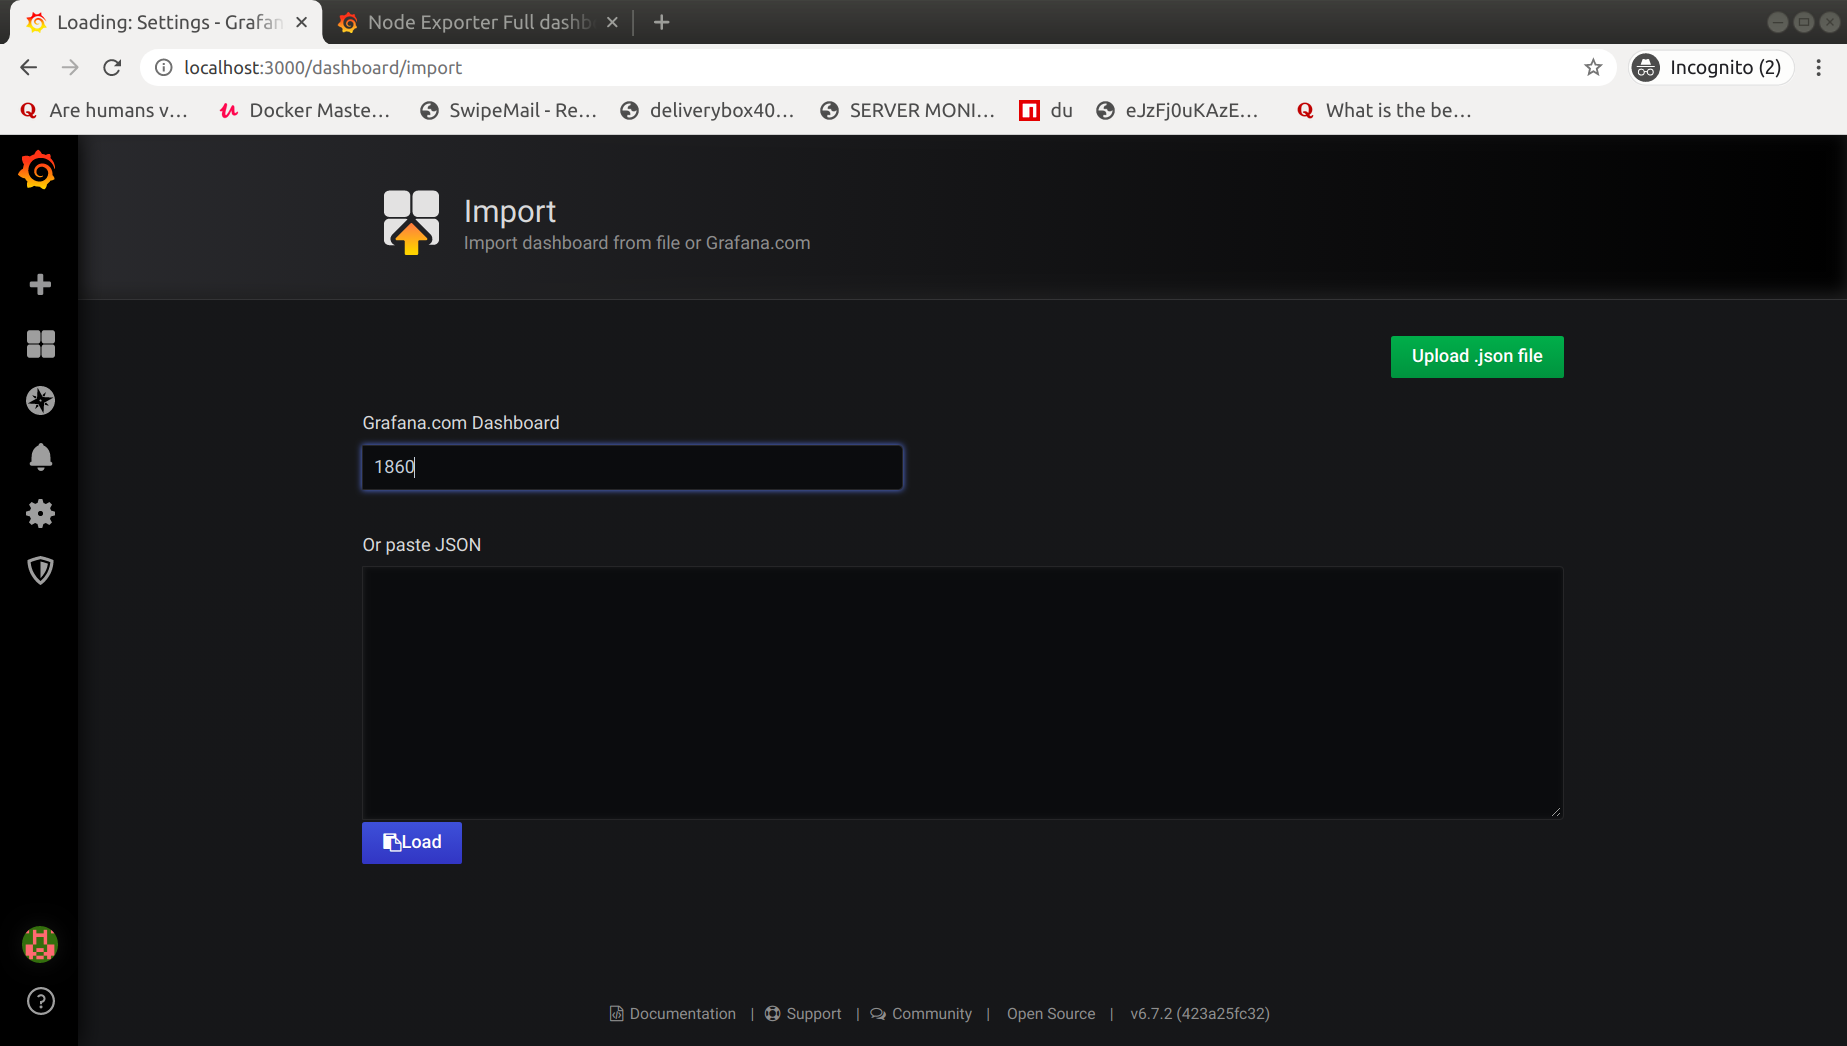
Enter the Name & select Prometheus on label Prometheus as shown in below image.
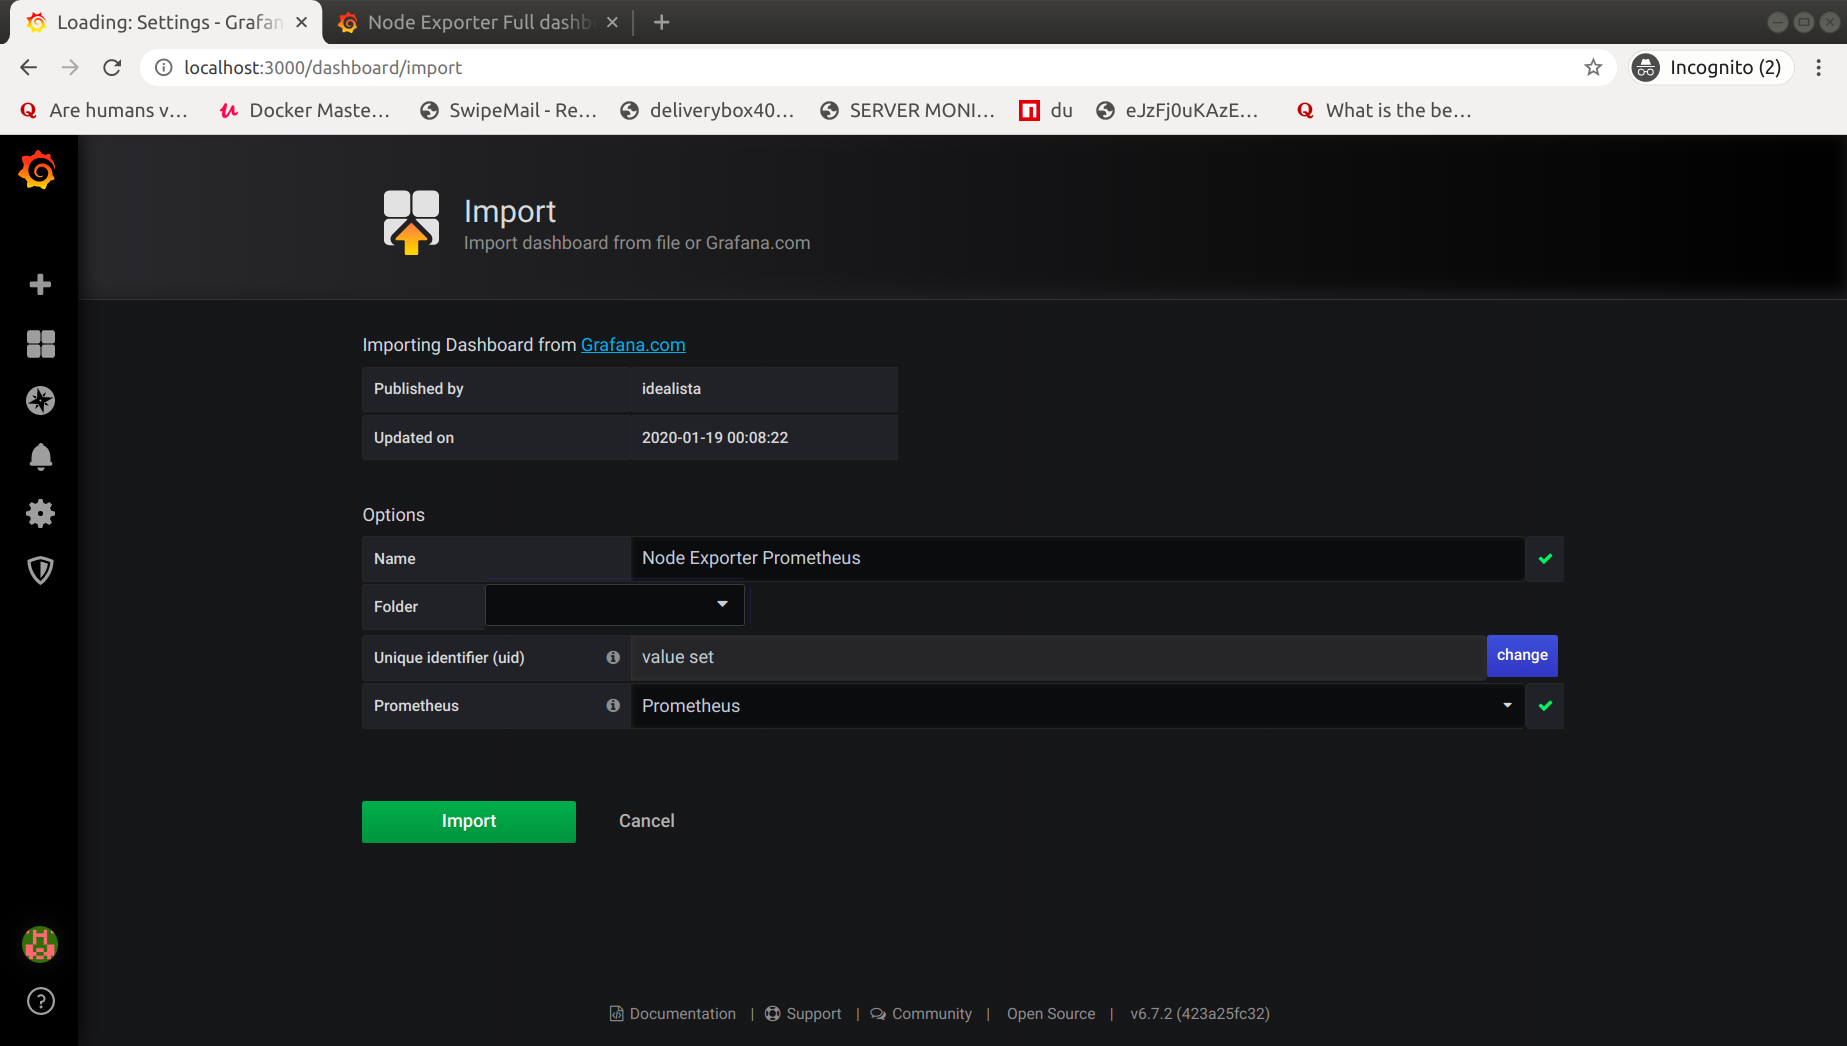
Click on Import.
Your Dashboard will be ready.
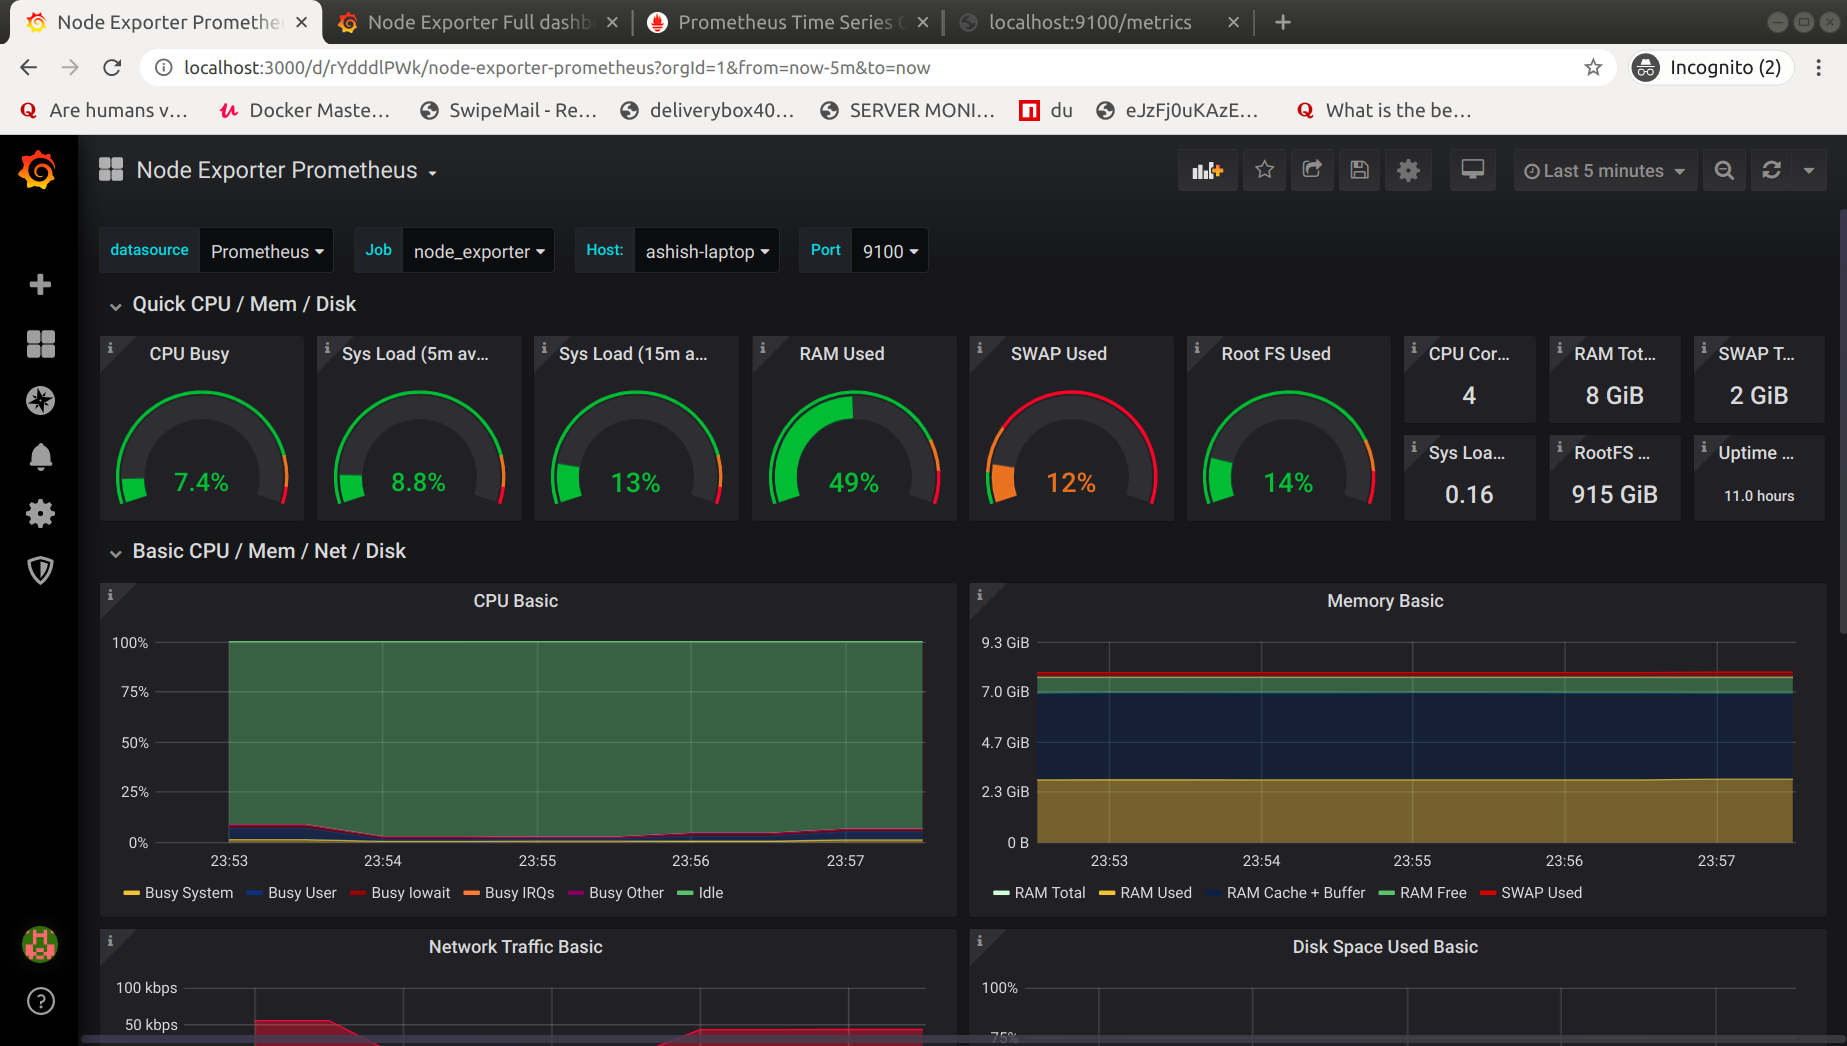
Here we have successfully integrated the Grafana with Prometheus. You can explore more features of Grafana like Alerts, Users, etc.
For the alerting system, I prefer Prometheus Alertmanager only. You can check more details on the Alertmanager in part 2. It gives you more control and advanced feature.
But every tool has use cases and built for special purposes. You can choose according to your requirements.
In case of any confusion or issues leave comments below :)