Introduction
In PART - 1, We have successfully setup Prometheus and exporters. In this part, we are going to setup alertmanager and will send our first alert.
Alertmanager is software that is maintained by the prometheus and it is written in Go. It takes care of deduplicating, grouping, and routing them to the correct receiver integration such as email, PagerDuty, or OpsGenie. It also takes care of silencing and inhibition of alerts.
Let’s setup alertmanage: )
Setup Alertmanager
Installation:
Prerequisites will be the same as PART - 1 . We will download the precompiled binary of alertmanager. Although there is a docker image also available which you can use.
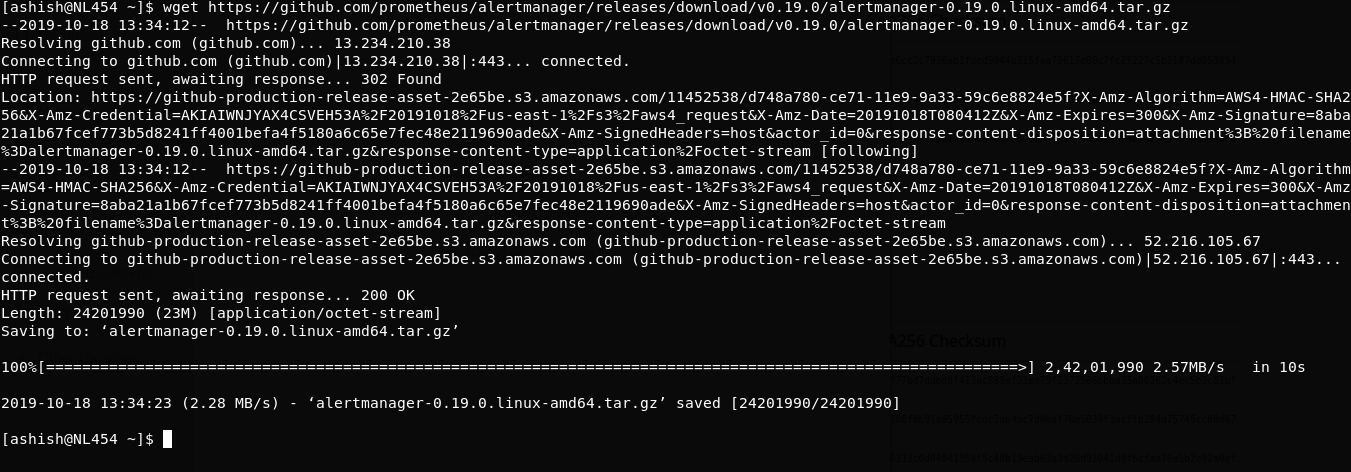
Step 1: Download alertmanager
$ wget https://github.com/prometheus/prometheus/releases/download/v2.13.1/prometheus-2.13.1.linux-amd64.tar.gz
Step 2: Extract tar
$ tar -xvzf alertmanager-0.19.0.linux-amd64.tar.gz
Step 3: Folder structure
$ mv alertmanager-0.19.0.linux-amd64 alertmanager
$ cd alertmanager/
$ ll
Folder contains below files:
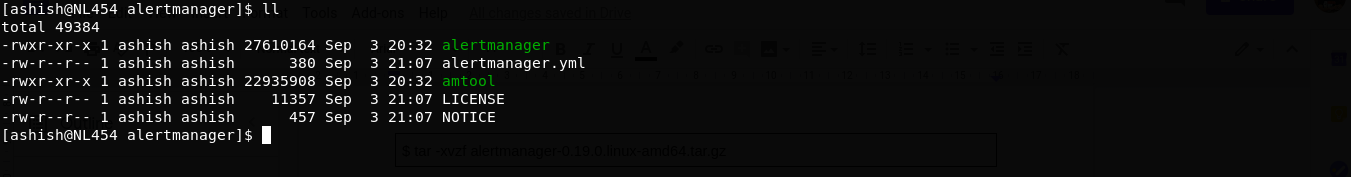
alertmanager: It is a binary file that is core Daemon of alertmanager.alertmanager.yml: This is config file for alertmanager service.amtool: It is another binary that can be used as a command line utility to manager or silence the alerts on alertmanager.
Step 4: Run alertmanager
Execute binary:
./alertmanager
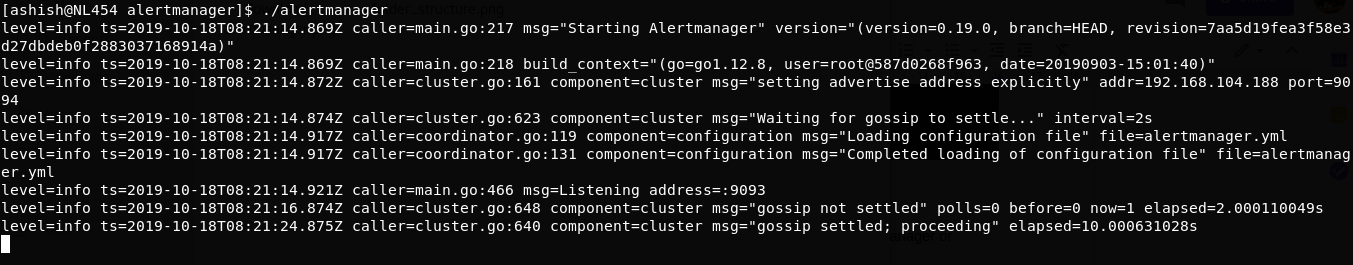
Visit to localhost:9093 on your browser:

Your alertmanager is up :) Like prometheus it is creating folder with the name data. Alertmanager starts storing data in /data folder.
To check alertmanager metrics just visit localhost:9093/metrics
My production execution command is
~/alertmanager/alertmanager --config.file=~/alertmanager/alertmanager.yml --storage.path=/var/lib/alertmanager --web.external-url=http://myurl.com:9093
--storage.tsdb.path: Specify the path where you want to save prometheus data.--web.external-url: You can use this option if you want to bind your address with your URL.
Step 5: Run alertmanager as service
- Create file
vim /etc/systemd/system/alertmanager.service
- Paste Below code
[Unit]
Description=AlertManager Server Service
Wants=network-online.target
After=network-online.target

[Service]
User=root
Type=Simple

ExecStart=~/alertmanager/alertmanager --config.file=~/alertmanager/alertmanager.yml --storage.path=/var/lib/alertmanager --web.external-url=http://myurl.com:9093

[Install]
WantedBy=multi-user.target
Save and exit.
It won’t run because alertmanager.yml is not defined yet. alertmanager.yml file is defined below.
- Reload the Systemctl Daemon:
$ sudo systemctl daemon-reload
- To start alertmanager service
$ sudo systemctl start alertmanager
Setup Alerts
Step 1: Add settings in prometheus.yml
Open prometheus.yml file
$ vim ~/prometheus/prometheus.yml
Add below code
scrape_configs:
  # The job name is added as a label `job=<job_name>` to any timeseries scraped from this config.
  - job_name: 'prometheus'

    # metrics_path defaults to '/metrics'
    # scheme defaults to 'http'.

    static_configs:
    - targets: ['localhost:9090']

    # Add below block for node_exporter
  - job_name: node_exporter
    scrape_interval: 1m
    scrape_timeout:  1m
    metrics_path: "/metrics"
    static_configs:
    - targets: ['localhost:9100']


#Alertmanager settings

rule_files:
  - '~/prometheus/alert.rules.yml'

alerting:
  alertmanagers:
  - static_configs:
    - targets:
      - 'myurl.com:9093'
rule_files: These are the files that contain all kinds of rules. Prometheus has own syntax to define rules. We will see this below.alerting: This is an option where we have to define alertmanager configuration. In target, we have definedmyurl.com:9093this is the exact port where our alertmanager is running.
Step 2: How prometheus service will work?
In above scrape_config we have defined scrape configurations. In the above example, prometheus will scrape node_exporter job at every 1 minute (scrape_interval is 1m. it will scrape all information which is available on localhost:9100/metrics (It will scrape all targets which is defined in the targets array).
It will store the data in the Internal database.
At every scraping, it will keep evaluating alert rules which defined in alert.rules.yml. As soon as any alert rules get true it will send an event to alertmanager on myurl.com:9093
Once alertmanager received events, It will check by which channel alert needs to be trigger like via slack, email pagerduty, etc which defined in alertmanager.yml & it will trigger an alert via appropriate channel. Now let’s define two files :
alert.rules.ymlalertmanager.yml
Step 3: Create alert.rules.yml
Create ~/prometheus/alert.rules.yml file and paste below sample rule:
groups:

- name: Disk-usage
  rules:
  - alert: 'Low data disk space'
    expr: ceil(((node_filesystem_size_bytes{mountpoint!="/boot"} - node_filesystem_free_bytes{mountpoint!="/boot"}) / node_filesystem_size_bytes{mountpoint!="/boot"} * 100)) > 95
    labels:
      severity: 'critical'
    annotations:
      title: "Disk Usage"
      description: 'Partition : {{$labels.mountpoint}}'
      summary: "Disk usage is `{{humanize $value}}%`"
      host: "{{$labels.instance}}"


- name: Memory-usage
  rules:
  - alert: 'High memory usage'
    expr: ceil((((node_memory_MemTotal_bytes - node_memory_MemFree_bytes - node_memory_Buffers_bytes - node_memory_Cached_bytes) / node_memory_MemTotal_bytes) * 100)) > 80
    labels:
      severity: 'critical'
    annotations:
      title: "Memory Usage"
      description: 'Memory usage threshold set to `80%`.'
      summary: "Memory usage is `{{humanize $value}}%`"
      host: "{{$labels.instance}}"
Here we have defined two rules.
- If memory utilization is exceeded than 80% then it will trigger an email.
- If any disk partition usage exceeded than 95% then it will trigger an email.
You will get more insights on defining alerting rules here.
Now you might be wondering what is node_filesystem_size_bytes or node_memory_MemTotal_bytes ?
If we recall part - 1 when we set up the node exporter and visited on localhost:9100/metrics, It has shown some metric. In that will get the above variable name. If you want to put any alert rules irrespective of any exporters, You have to make expr using these variables.
You can compile your alert rule file :
$ promtool check rules alert.rules.yml
promtool is binary which we got in prometheus folder when we extracted it.
You can explore some sample rules here.
Step 4: Create alertmanager.yml
Create ~/alertmanager/alertmanager.yml file and paste below code:
global:
  slack_api_url: "https://hooks.slack.com/services/XXXXXXXXXXXXXXX"

route:

  receiver: "default"
  routes:
   - match:
      severity: info
     receiver: slack

   - match:
      severity: critical
     receiver: email
     group_wait: 30s
     group_interval: 5m
     repeat_interval: 5m

receivers:
  - name: default
    email_configs:
     - to: 'to@youremail.com'
       from: 'default-alerts@yourdomain.com'
       smarthost: 'smtp.host.com:2525'
       auth_username: "smtpusername"
       auth_password: "smtppassword"
       html: '{{ template "email" .}}'

  - name: slack
    slack_configs:
      - send_resolved: true
        username: '{{ template "slack.default.username" . }}'
        color: '{{ if eq .Status "firing" }}good{{ else }}good{{ end }}'
        title: '{{ template "slack.default.title" . }}'
        title_link: '{{ template "slack.default.titlelink" . }}'
        pretext: '{{ .CommonAnnotations.summary }}'
        text:
         >-
          {{ range .Alerts }}
           *Alert:* {{ .Annotations.summary }} - `{{ .Labels.severity }}`:bar_chart:
           *Description:* {{ .Annotations.description }}
           *Details:*
           {{ range .Labels.SortedPairs }} • *{{ .Name }}:* `{{ .Value }}`
           {{ end }}
          {{ end }}


  - name: email
    email_configs:
     - to: 'to@youremail.com'
       from: 'default-alerts@yourdomain.com'
       smarthost: 'smtp.host.com:2525'
       auth_username: "smtpusername"
       auth_password: "smtppassword"
       html: '{{ template "email" .}}'

templates:
- '~/prometheus/alert.tmpl'
Here we have setup two channel email and slack for alert. if you see alertmanager.yml file, There are four main components I defined.
global: Here we can define any global variable like we definedslack_api_url.route: It is a routing block. I am playing routing onseverity. Similarly, it is your choice on which variable you want to route your alerts. So here ifseverity == ‘info’, Alert will go from slack or ifseverity == ‘critical’, Alert will go via an email.receivers: Here we can define the channel by which alert will go. For now, I have defined only email & slack. You can explore more receivers here.templates: It is an alert template where I have defined the HTML template for an email alert. It is not restricted to email. You can define a template for any channel. Explore more details about templates here.
Step 5: Sample template
Create and Paste below code in ~/prometheus/alert.tmpl
{{ define "email" }}

<html>
   <head>
      <style type="text/css">
         table {
         font-family: verdana,arial,sans-serif;
         font-size:11px;
         color:#333333;
         border-width: 1px;
         border-color: #999999;
         border-collapse: collapse;
         }
         table th {
         background-color:#ff6961;
         border-width: 1px;
         padding: 8px;
         border-style: solid;
         border-color: #F54C44;
         }
         table td {
         border-width: 1px;
         padding: 8px;
         border-style: solid;
         border-color: #F54C44;
         text-align: right;
         }
      </style>
   </head>
   <body>
      <table border=1>
         <thead>
           <tr>
        <th>Alert name</th>
        <th>Host</th>
            <th>Summary</th>
            <th>Description</th>
           </tr>
         </thead>

         <tbody>
       {{ range .Alerts }}
            <tr>
         <td>{{ .Labels.alertname }}</td>
         <td>{{ .Annotations.host }}</td>
         <td>{{ .Annotations.summary }}</td>
         <td>{{ .Annotations.description }}</td>
           </tr>
          {{ end }}
         </tbody>

      </table>
  </body>
</html>

{{end}}
Step 6: Start alertmanager service & restart prometheus
$ sudo systemctl start alertmanager
$ sudo systemctl restart prometheus
Test complete Integration:
If everything is set up correctly and alert rule getting true then it will trigger an alert. You can enable the log of alertmanager for debugging purposes.
If you want to test alert, Then simply make threshold to very less 0% or 1% after 30s it should trigger the alert.
Visit localhost:9093. If there is some alert you will get the list on the dashboard.
So we successfully setup alert using alertmanager. In part - 3 I have explained how you can write your own custom exporters & You can check part - 4 to integrate Grafana with Prometheus.