Introduction
As a developer, you need to log everything it may be info, error or debug logs, etc. There are multiple types of log formats like Common log, JSON log, etc. and there are already solutions available in an elastic stack like filebeat to read JSON logs and push them to elasticsearch.
There can be cases where you need to log the data according to your convenience which will not be any standard log format. Or sometimes you just need to dump the log in an unstructured way but you need to have it in a structured format if you want to analyze those.
In this article, we are going to see how we can parse custom logs of any format into Elasticsearch. Elasticsearch provides the ingest pipeline with grok processor which will be able to match any unstructured log.
Overview
Ingest Pipeline
Elasticsearch gives ingest pipeline where it let you perform different types of operations or data transformations before indexing the data. The pipeline consists of a series of various processors.
Each processor in the pipeline takes input and produces the output. That output goes as input to the next processor.
Like below, After converting into lowercase letters by “lowercase processor” it sends the same string as input to the “split processor”.
Example
{"date":"HELLO - WORLD"} Input → | lowercase processor ({"date":"hello - world"}) → split processor ({"date":"hello world"}) | → Index
You can check more about ingest pipeline and processors.
Grok Processor
Grok Processor allows you to extract structured data from the ingested value on the specific field. Grok Processor works with grok patterns.
Let’s suppose you have the following document
{
    "Ip":"1.2.3.4",
    "country":"India",
    "log":"LEVEL:ERROR,method:fetchUser(),message:user not found"
}
You can mention the field name (Ex. log) where you want to apply a grok processor. The Grok processor uses the Grok pattern.
Grok pattern
Grok pattern is the regular expression which is the alias of some of the predefined expressions which can be reused.
Below is some sample grok patterns:
HOSTNAME \b(?:[0-9A-Za-z][0-9A-Za-z-]{0,62})(?:\.(?:[0-9A-Za-z][0-9A-Za-z-]{0,62}))*(\.?|\b)
USERNAME [a-zA-Z0-9._-]+
USER %{USERNAME}
SPACE \s*
Here HOSTNAME, USERNAME, USER & SPACE are Grok pattern names.
I can directly use SPACE label to define regex for space instead of a regular pattern like \s*. Also, the Grok pattern can be reused as the same as USERNAME.
Pattern list
You can find all pattern list on the below link:
https://github.com/elastic/elasticsearch/tree/8.1/libs/grok/src/main/resources/patterns
You can select any folder and explore all the patterns.
Grok pattern: https://github.com/elastic/elasticsearch/blob/master/libs/grok/src/main/resources/patterns/ecs-v1/grok-patterns
The flow
- Create & Test Ingest Pipeline
- Index custom data
Lets create the pipeline with a grok processor which is going to parse the message field with the document below.
{
    "Ip":"1.2.3.4",
    "country":"India",
    "message":"LEVEL:ERROR,method:fetchUser(),message:user not found,code:123"
}
I would like to extract the below data from message field and index into elasticsearch,
"method_name" : "fetchUser",
"log_level" : "ERROR",
"response_code" : "123",
"message" : "user not found"
Create & Test Ingest Pipeline
Syntax
%{SYNTAX:ID}
SYNTAX: It is the pattern name.
ID: It is the key name of the document.
Data need to parse
LEVEL:ERROR,method:fetchUser(),message:user not found
Let’s match some of the grok patterns from the below file https://github.com/elastic/elasticsearch/blob/master/libs/grok/src/main/resources/patterns/ecs-v1/grok-patterns
ERROR = %{LOGLEVEL:log_level}
fetchUser = %{WORD:method_name}
user not found = %{GREEDYDATA:message}
123 = code:(?<response_code>(?:[+-]?(?:[0-9]+)))
Data
LEVEL:ERROR,method:fetchUser(),message:user not found
Final Pattern
"LEVEL:%{LOGLEVEL:log_level},method:%{WORD:method_name}\\(\\),message:%{GREEDYDATA:message},code:(?<response_code>(?:[+-]?(?:[0-9]+)))"
Note: You can add your own regex as well. For example, I have added regex for
code.
Test pipeline
For testing above pattern or pipeline we can use Simulate Pipeline API like below:
_simulate
POST /_ingest/pipeline/_simulate?pretty
{
  "pipeline": {
    "description" : "testing grok processor",
    "processors": [
      {
        "grok": {
          "field": "log",
          "patterns": ["LEVEL:%{LOGLEVEL:log_level},method:%{WORD:method_name}\\(\\),message:%{GREEDYDATA:message},code:(?<response_code>(?:[+-]?(?:[0-9]+)))"]
        }
      }
    ]
  },
  "docs":[
    {
      "_source": {
        "log": "LEVEL:ERROR,method:fetchUser(),message:user not found,code:123"
      }
    }
  ]
}
Response
{
  "docs" : [
    {
      "doc" : {
        "_index" : "_index",
        "_id" : "_id",
        "_source" : {
          "response_code" : "123",
          "log" : "LEVEL:ERROR,method:fetchUser(),message:user not found,code:123",
          "method_name" : "fetchUser",
          "log_level" : "ERROR",
          "message" : "user not found"
        },
        "_ingest" : {
          "timestamp" : "2022-04-29T14:20:59.454111422Z"
        }
      }
    }
  ]
}
As you can see we got the desired output. Now let’s save the pipeline.
Save pipeline
Pipeline can be saved using _ingest/pipeline API.
PUT /_ingest/pipeline/custom_log?pretty
{
  "description" : "testing grok processor",
  "processors": [
    {
      "grok": {
        "field": "log",
        "patterns": ["LEVEL:%{LOGLEVEL:log_level},method:%{WORD:method_name}\\(\\),message:%{GREEDYDATA:message},code:(?<response_code>(?:[+-]?(?:[0-9]+)))"]
      }
    }
  ]
}
Custom_log: It is the pipeline name. We need to specify the pipeline name while indexing the data.
Index custom data
Now let’s index some data with the same pipeline which we created.
POST data-stream/_doc?pipeline=custom_log
{
  "log" : "LEVEL:INFO,method:addUser(),message:user added successfully.,code:200"
}

POST data-stream/_doc?pipeline=custom_log
{
  "log" : "LEVEL:DEBUG,method:deleteUser(),message:user_id notfound.,code:433"
}

POST data-stream/_doc?pipeline=custom_log
{
  "log" : "LEVEL:ERROR,method:fetchUser(),message:Database connection timeout,code:567"
}
Check all data
GET data-stream/_search?pretty
{
  "took" : 898,
  "timed_out" : false,
  "_shards" : {
    "total" : 1,
    "successful" : 1,
    "skipped" : 0,
    "failed" : 0
  },
  "hits" : {
    "total" : {
      "value" : 3,
      "relation" : "eq"
    },
    "max_score" : 1.0,
    "hits" : [
      {
        "_index" : "data-stream",
        "_id" : "3460dYABYeDE95hG23XJ",
        "_score" : 1.0,
        "_source" : {
          "response_code" : "200",
          "log" : "LEVEL:INFO,method:addUser(),message:user added successfully.,code:200",
          "method_name" : "addUser",
          "log_level" : "INFO",
          "message" : "user added successfully."
        }
      },
      {
        "_index" : "data-stream",
        "_id" : "Kwi2dYABbuPmoOiCSUjL",
        "_score" : 1.0,
        "_source" : {
          "response_code" : "433",
          "log" : "LEVEL:DEBUG,method:deleteUser(),message:user_id notfound.,code:433",
          "method_name" : "deleteUser",
          "log_level" : "DEBUG",
          "message" : "user_id notfound."
        }
      },
      {
        "_index" : "data-stream",
        "_id" : "LAi4dYABbuPmoOiCmUgb",
        "_score" : 1.0,
        "_source" : {
          "response_code" : "567",
          "log" : "LEVEL:ERROR,method:fetchUser(),message:Database connection timeout,code:567",
          "method_name" : "fetchUser",
          "log_level" : "ERROR",
          "message" : "Database connection timeout"
        }
      }
    ]
  }
}
Parsing common log format
Common log format is standard format for logging which is used by webservers and system log generators etc.
Let’s say we having below log:
97.92.139.153 1254 ashishtiwari [04/Mar/2022:15:18:55 +0530] "GET /niches HTTP/1.1" 201 2322
Grok Pattern
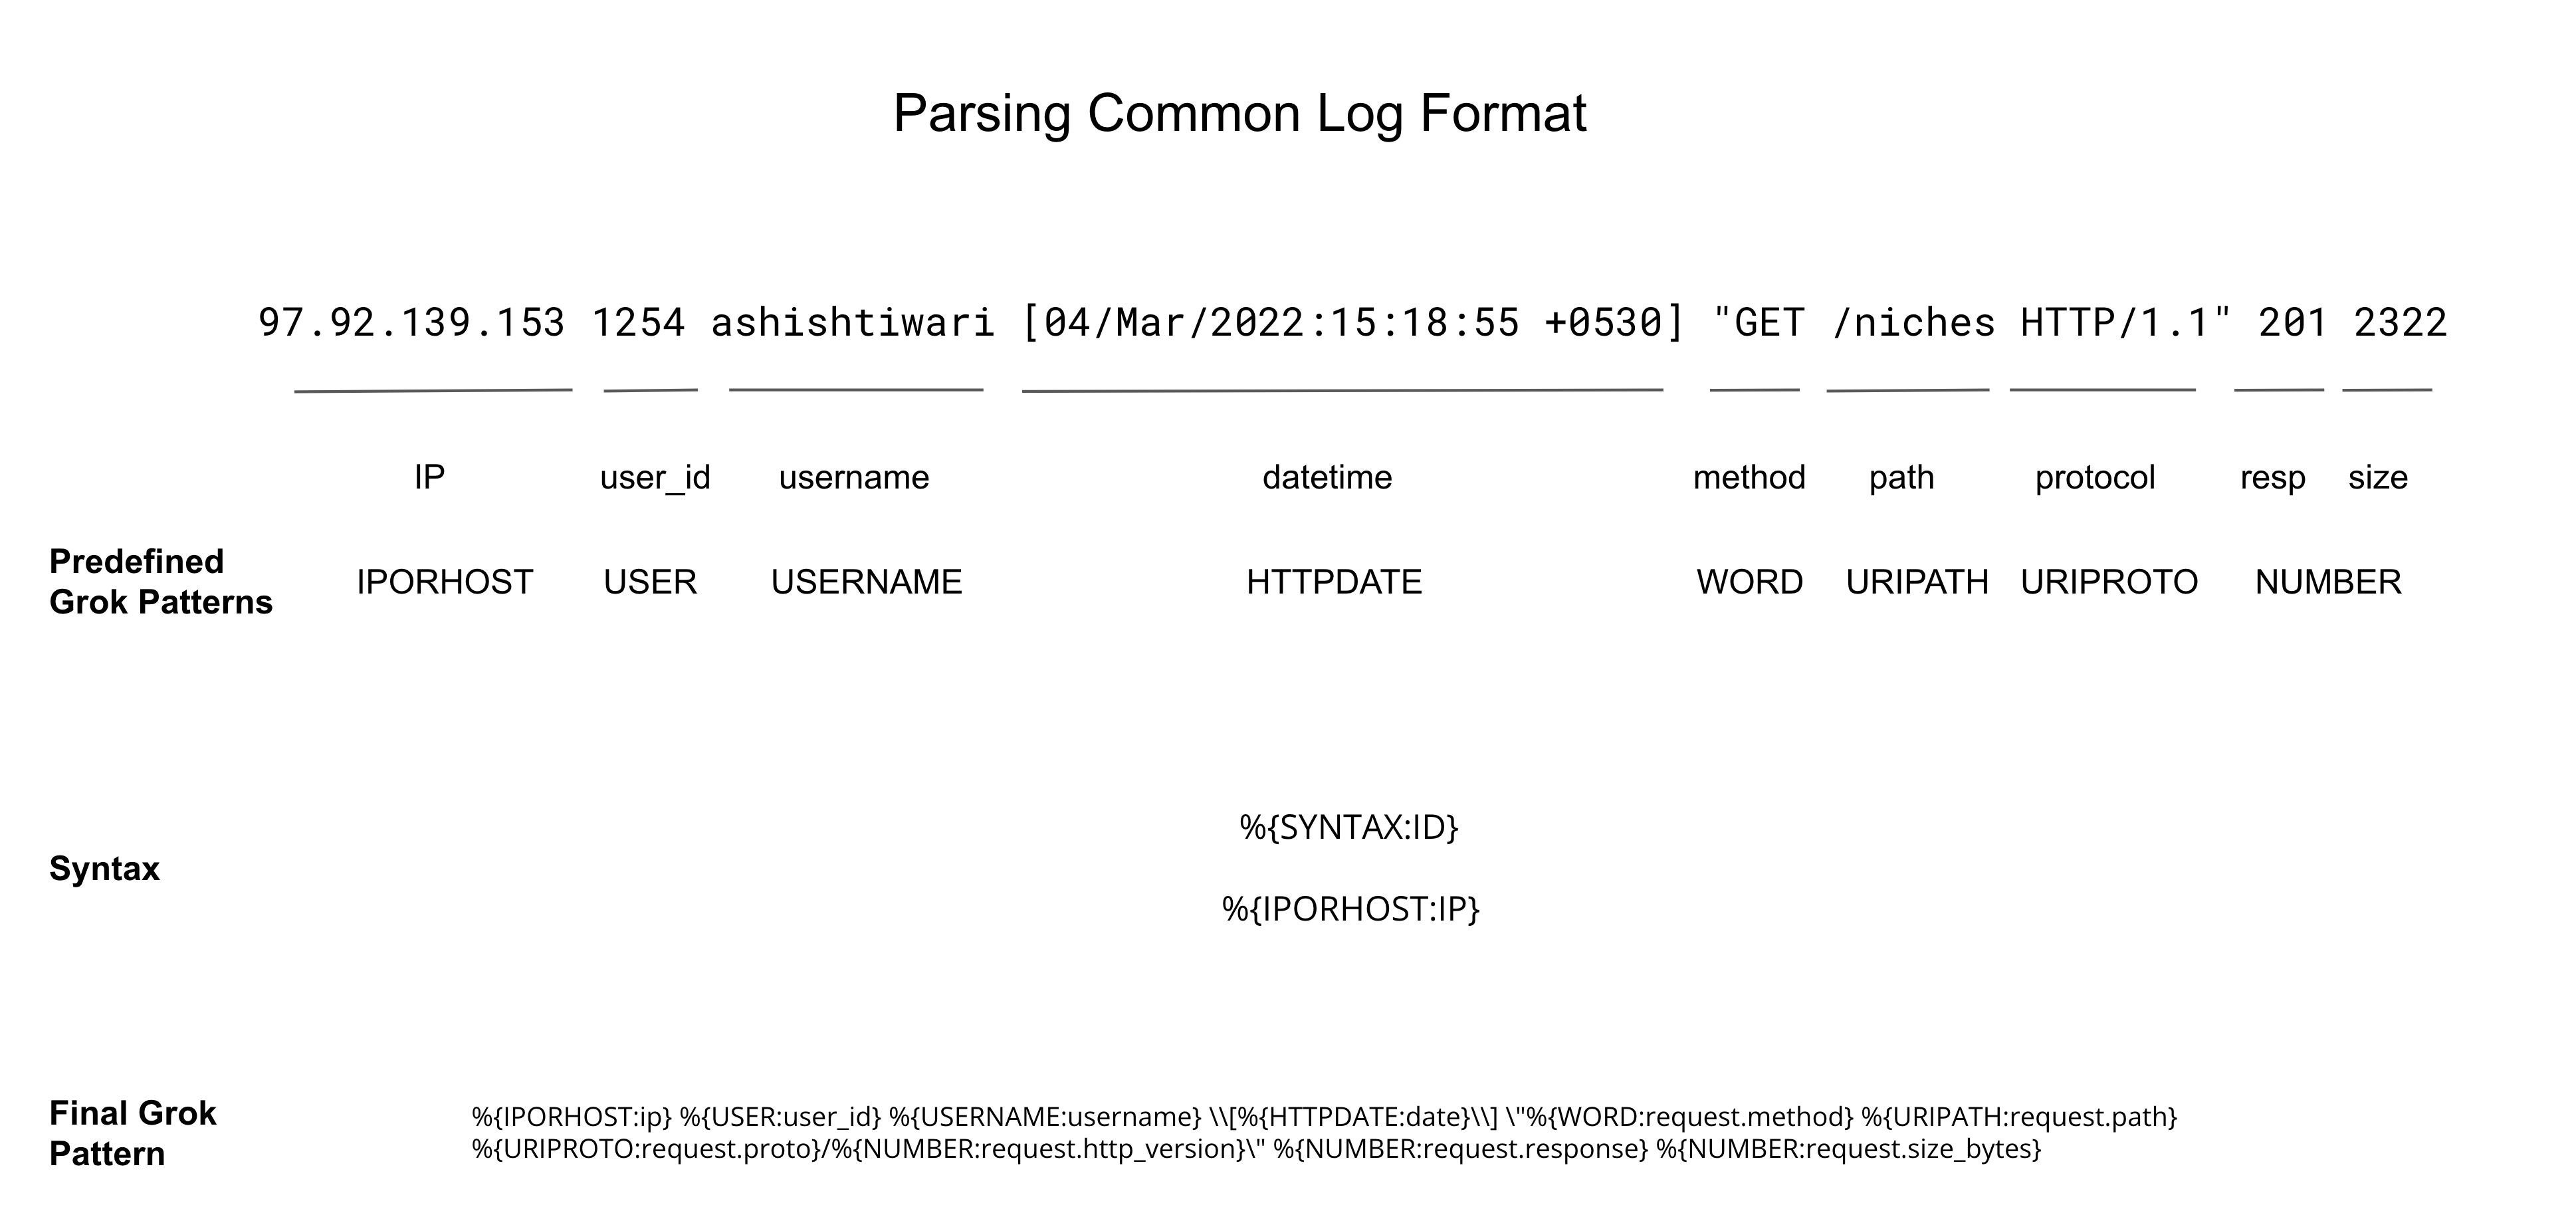
Final Grok Pattern
%{IPORHOST:ip} %{USER:user_id} %{USERNAME:username} \\[%{HTTPDATE:date}\\] \"%{WORD:request.method} %{URIPATH:request.path} %{URIPROTO:request.proto}/%{NUMBER:request.http_version}\" %{NUMBER:request.response} %{NUMBER:request.size_bytes}
_simulate
Lets simulate the pipeline with above grok pattern
POST /_ingest/pipeline/_simulate?pretty
{
  "pipeline": {
    "description" : "testing grok processor",
    "processors": [
      {
        "grok": {
          "field": "log",
          "patterns": ["%{IPORHOST:ip} %{USER:user_id} %{USERNAME:username} \\[%{HTTPDATE:date}\\] \"%{WORD:request.method} %{URIPATH:request.path} %{URIPROTO:request.proto}/%{NUMBER:request.http_version}\" %{NUMBER:request.response} %{NUMBER:request.size_bytes}"]
        }
      }
    ]
  },
  "docs":[
    {
      "_source": {
        "log": "97.92.139.153 1254 ashishtiwari [04/Mar/2022:15:18:55 +0530] \"GET /niches HTTP/1.1\" 201 2322"
      }
    }
  ]
}
Response
{
  "docs" : [
    {
      "doc" : {
        "_index" : "_index",
        "_id" : "_id",
        "_source" : {
          "date" : "04/Mar/2022:15:18:55 +0530",
          "request" : {
            "path" : "/niches",
            "size_bytes" : "2322",
            "method" : "GET",
            "response" : "201",
            "proto" : "HTTP",
            "http_version" : "1.1"
          },
          "log" : """97.92.139.153 1254 ashishtiwari [04/Mar/2022:15:18:55 +0530] "GET /niches HTTP/1.1" 201 2322""",
          "user_id" : "1254",
          "ip" : "97.92.139.153",
          "username" : "ashishtiwari"
        },
        "_ingest" : {
          "timestamp" : "2022-04-29T14:42:51.765427484Z"
        }
      }
    }
  ]
}
As we can see it successfully parsed the data. You can save the pipeline and index the data as shown on the above steps.
Similarly you can parse any log format with Grok pattern.
Demo
You can also check the demo on the below link where I presented how you can parse common log format using ingest pipeline and grok processor.
https://ashish.one/talks/devops-conf-2022/
Conclusion
We have seen how we can parse any types of log format into elasticsearch with the help of ingest pipeline & grok processor. You can also use this ingest pipeline with filebeat or logstash. Where you just need to specify the pipeline name.
Feel free to put in comments if you have any doubts.