In this blog, we will see how you can quickly setup ELK (Elasticsearch, Logstash, Kibana) stack to receive the HTTP webhook. Mostly ELK stack is known for logging purposes. But Elastic stacks are much more beyond the logging use case. Elastic provides Search, Observability & Security you can check more on this with official documentation.
What is Webhook ?
Webhook enables the two programs to communicate or transfer the data with the help of callback functions / hooks. Now in the modern tech world it is also known as Reverse API, Push API etc. Mostly it is used to send small amounts of data from source to destination. It is a one way data transfer procedure. It works over the HTTP protocol using REST API. It is simple like client and server communication. Most of the saas allow you to integrate their product with your system with the help of APIs and Webhook only. E.g. Slack and discord allows you to push messages with the help of webhooks. To accept the webhook event, You need to expose one HTTP endpoint lets say
POST /message
In the above example, your system will accept messages from a third party system. Here you can setup authentication, Method, required parameters etc. and convey to users who are going to use this webhook.
So I have to use the POST method, and send data on the above endpoint. You can hit this Endpoint using curl, postman or any programming language.
What is ELK ?
Well from elastic.co -
E - Elasticsearch - Elasticsearch is a distributed, free and open search and analytics engine for all types of data, including textual, numerical, geospatial, structured, and unstructured. Check more here.
L - logstash - Logstash is a free and open server-side data processing pipeline that ingests data from a multitude of sources, transforms it, and then sends it to your favorite “stash.” check more here.
K - Kibana - Kibana is an free and open frontend application that sits on top of the Elastic Stack, providing search and data visualization capabilities for data indexed in Elasticsearch. Check more here.
The Flow
Events -> Logstash -> Elasticsearch <- Kibana
Logstash works with three plugins - input, filter, output.
You can choose any source as a input. For example you can use jdbc input plugin to read data from mysql.
Transform your data with the help of filter plugin.
Push the data on destination which you have specified in output plugin.
We will use below plugins to process the webhooks requests.
- Input plugin -> HTTP
- Output plugin -> Elasticsearch
Logstash will process the event and push to the Elasticsearch. Visualise data from kibana.
Implementation
Installation
You can simply follow the official documentation for installation.
- Elasticsearch - https://www.elastic.co/guide/en/elasticsearch/reference/current/install-elasticsearch.html
- Kibana - https://www.elastic.co/guide/en/logstash/current/installing-logstash.html
- Logstash - https://www.elastic.co/guide/en/logstash/current/installing-logstash.html
I am spinning ELK instances using docker. You can choose any method mentioned on above links.
Verify
Lets verify everything is up and running properly.
Elasticsearch
Hit below curl command:
curl --cacert path/to/ca.crt -u elastic:pass@123 https://localhost:9200
Response
{
  "name" : "es01",
  "cluster_name" : "docker-cluster",
  "cluster_uuid" : "_CDp3XgbQUKTuQxZWVLh6A",
  "version" : {
    "number" : "8.6.0",
    "build_flavor" : "default",
    "build_type" : "docker",
    "build_hash" : "f67ef2df40237445caa70e2fef79471cc608d70d",
    "build_date" : "2023-01-04T09:35:21.782467981Z",
    "build_snapshot" : false,
    "lucene_version" : "9.4.2",
    "minimum_wire_compatibility_version" : "7.17.0",
    "minimum_index_compatibility_version" : "7.0.0"
  },
  "tagline" : "You Know, for Search"
}
Logstash
Simply check the log file if there is any error.
tail -f logs/logstash-plain.log
Kibana
Simply visit https://localhost:5601. Try to login in kibana with credentials.
Now the ELK stack is up and running. Lets create the logstash configuration file to receive the webhook request and push to elasticsearch.
Logstash pipeline
Create file webhook.conf on the path which you have specified at path.config settings. You can set this setting at config/logstash.yml or config/pipeline.yml.
webhook.conf
input {
  http {
    port => 4000
  }
}

filter {
  json {
    source => "message"
  }
}

output {
  elasticsearch {
    hosts => ["https://es01:9200"]
    cacert => '/usr/share/logstash/pipeline/certs/ca.crt'
    user => 'elastic'
    password => 'pass@123'
    index => 'webhook'
  }
}
We are configuring HTTP endpoint on port 4000. So whenever anyone calls the webhook endpoint, they need to specify port like http://mydomain.com:4000
Here i am only defining the index but you can configure data stream as well. Check here for more options.
Test configuration
Run pipeline with below command:
./bin/logstash -f webhook-receiver.conf
Check if any errors are there.
If everything seems fine, Let’s start the logstash service.
Test
Push sample data
curl -XPOST -H 'Content-type:applicaton/json' http://localhost:4000 -d '{"test_key1":"test_value1","info":{"name":"Ashish","last_name":"Tiwari"},"my_list":["el1","el2"]}'
Response
ok%
Verify data in elasticsearch
Login to kibana by visiting localhost:5601.
Navigate to Menu -> Management -> Dev Tools
Lets see if Index is created or not.
GET _cat/indices?v
Response
health status index   uuid                   pri rep docs.count docs.deleted store.size pri.store.size
yellow open   webhook LiXxWLy5QvKkpYpmLLbYsw   1   1          1            0     12.5kb         12.5kb
I can see the index webhook has been created. Also the docs.count is 1 which means data has been inserted.
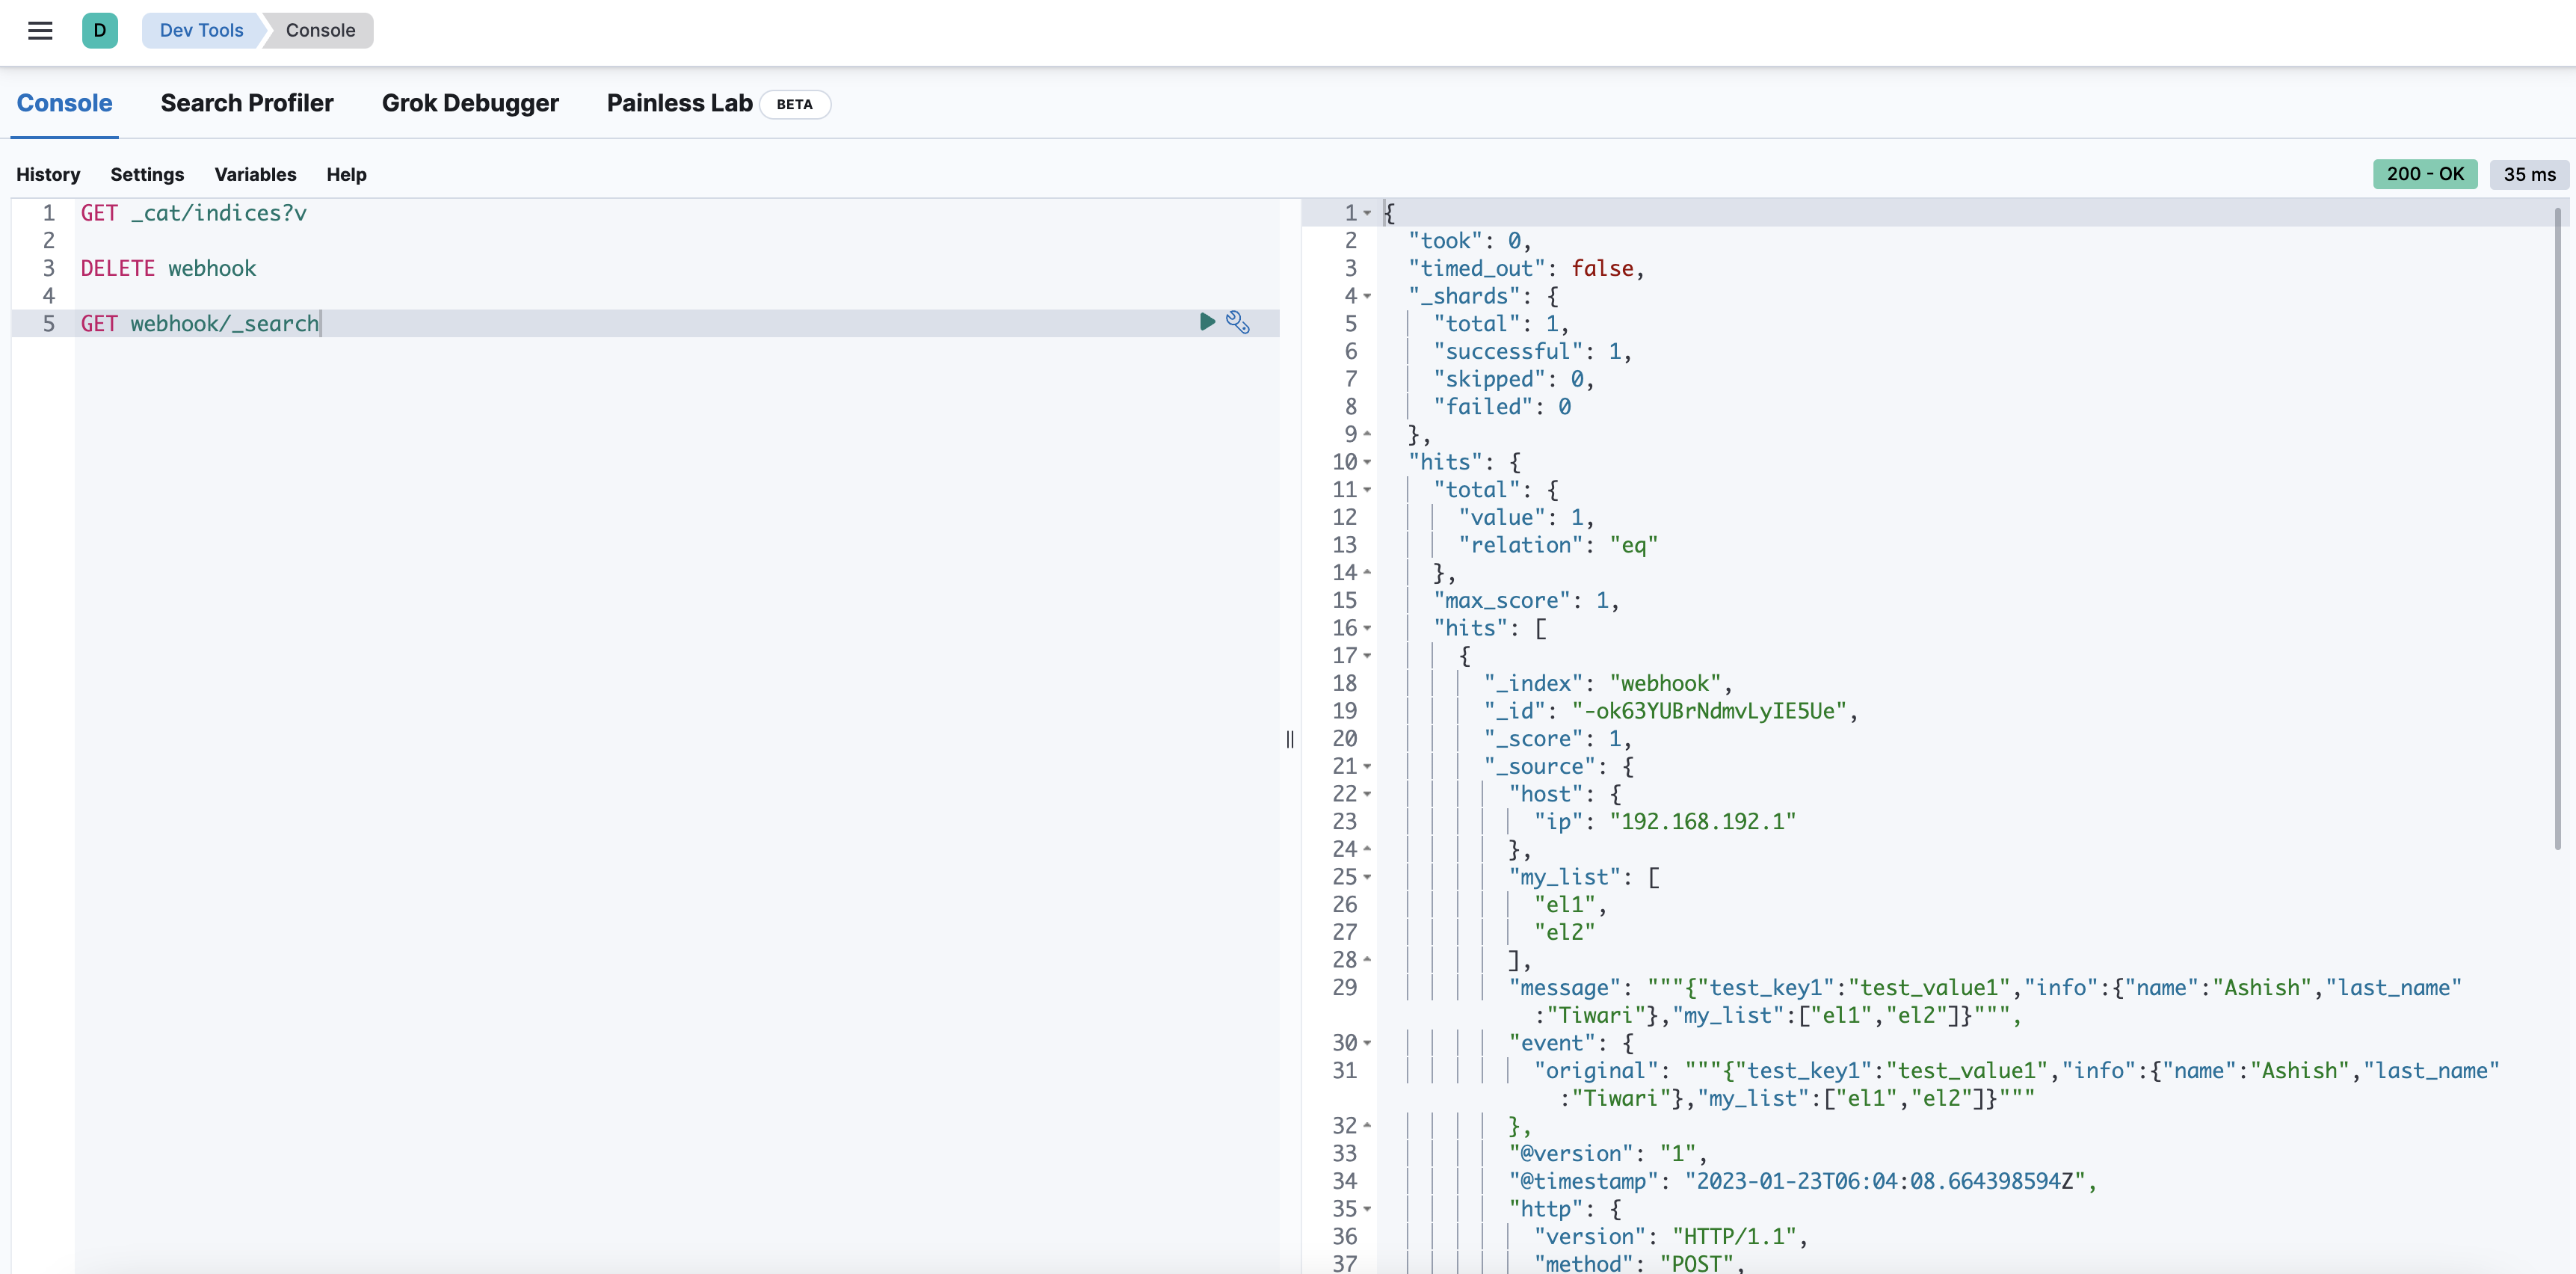
Lets see the data.
GET webhook/_search
Response
{
  "took": 0,
  "timed_out": false,
  "_shards": {
    "total": 1,
    "successful": 1,
    "skipped": 0,
    "failed": 0
  },
  "hits": {
    "total": {
      "value": 1,
      "relation": "eq"
    },
    "max_score": 1,
    "hits": [
      {
        "_index": "webhook",
        "_id": "-ok63YUBrNdmvLyIE5Ue",
        "_score": 1,
        "_source": {
          "host": {
            "ip": "192.168.192.1"
          },
          "my_list": [
            "el1",
            "el2"
          ],
          "message": """{"test_key1":"test_value1","info":{"name":"Ashish","last_name":"Tiwari"},"my_list":["el1","el2"]}""",
          "event": {
            "original": """{"test_key1":"test_value1","info":{"name":"Ashish","last_name":"Tiwari"},"my_list":["el1","el2"]}"""
          },
          "@version": "1",
          "@timestamp": "2023-01-23T06:04:08.664398594Z",
          "http": {
            "version": "HTTP/1.1",
            "method": "POST",
            "request": {
              "mime_type": "applicaton/json",
              "body": {
                "bytes": "97"
              }
            }
          },
          "info": {
            "last_name": "Tiwari",
            "name": "Ashish"
          },
          "user_agent": {
            "original": "curl/7.79.1"
          },
          "url": {
            "path": "/",
            "domain": "localhost",
            "port": 4000
          },
          "test_key1": "test_value1"
        }
      }
    ]
  }
}
If you are able to see data like above, Your webhook receiver is all set to accept requests.
Data Visualisation
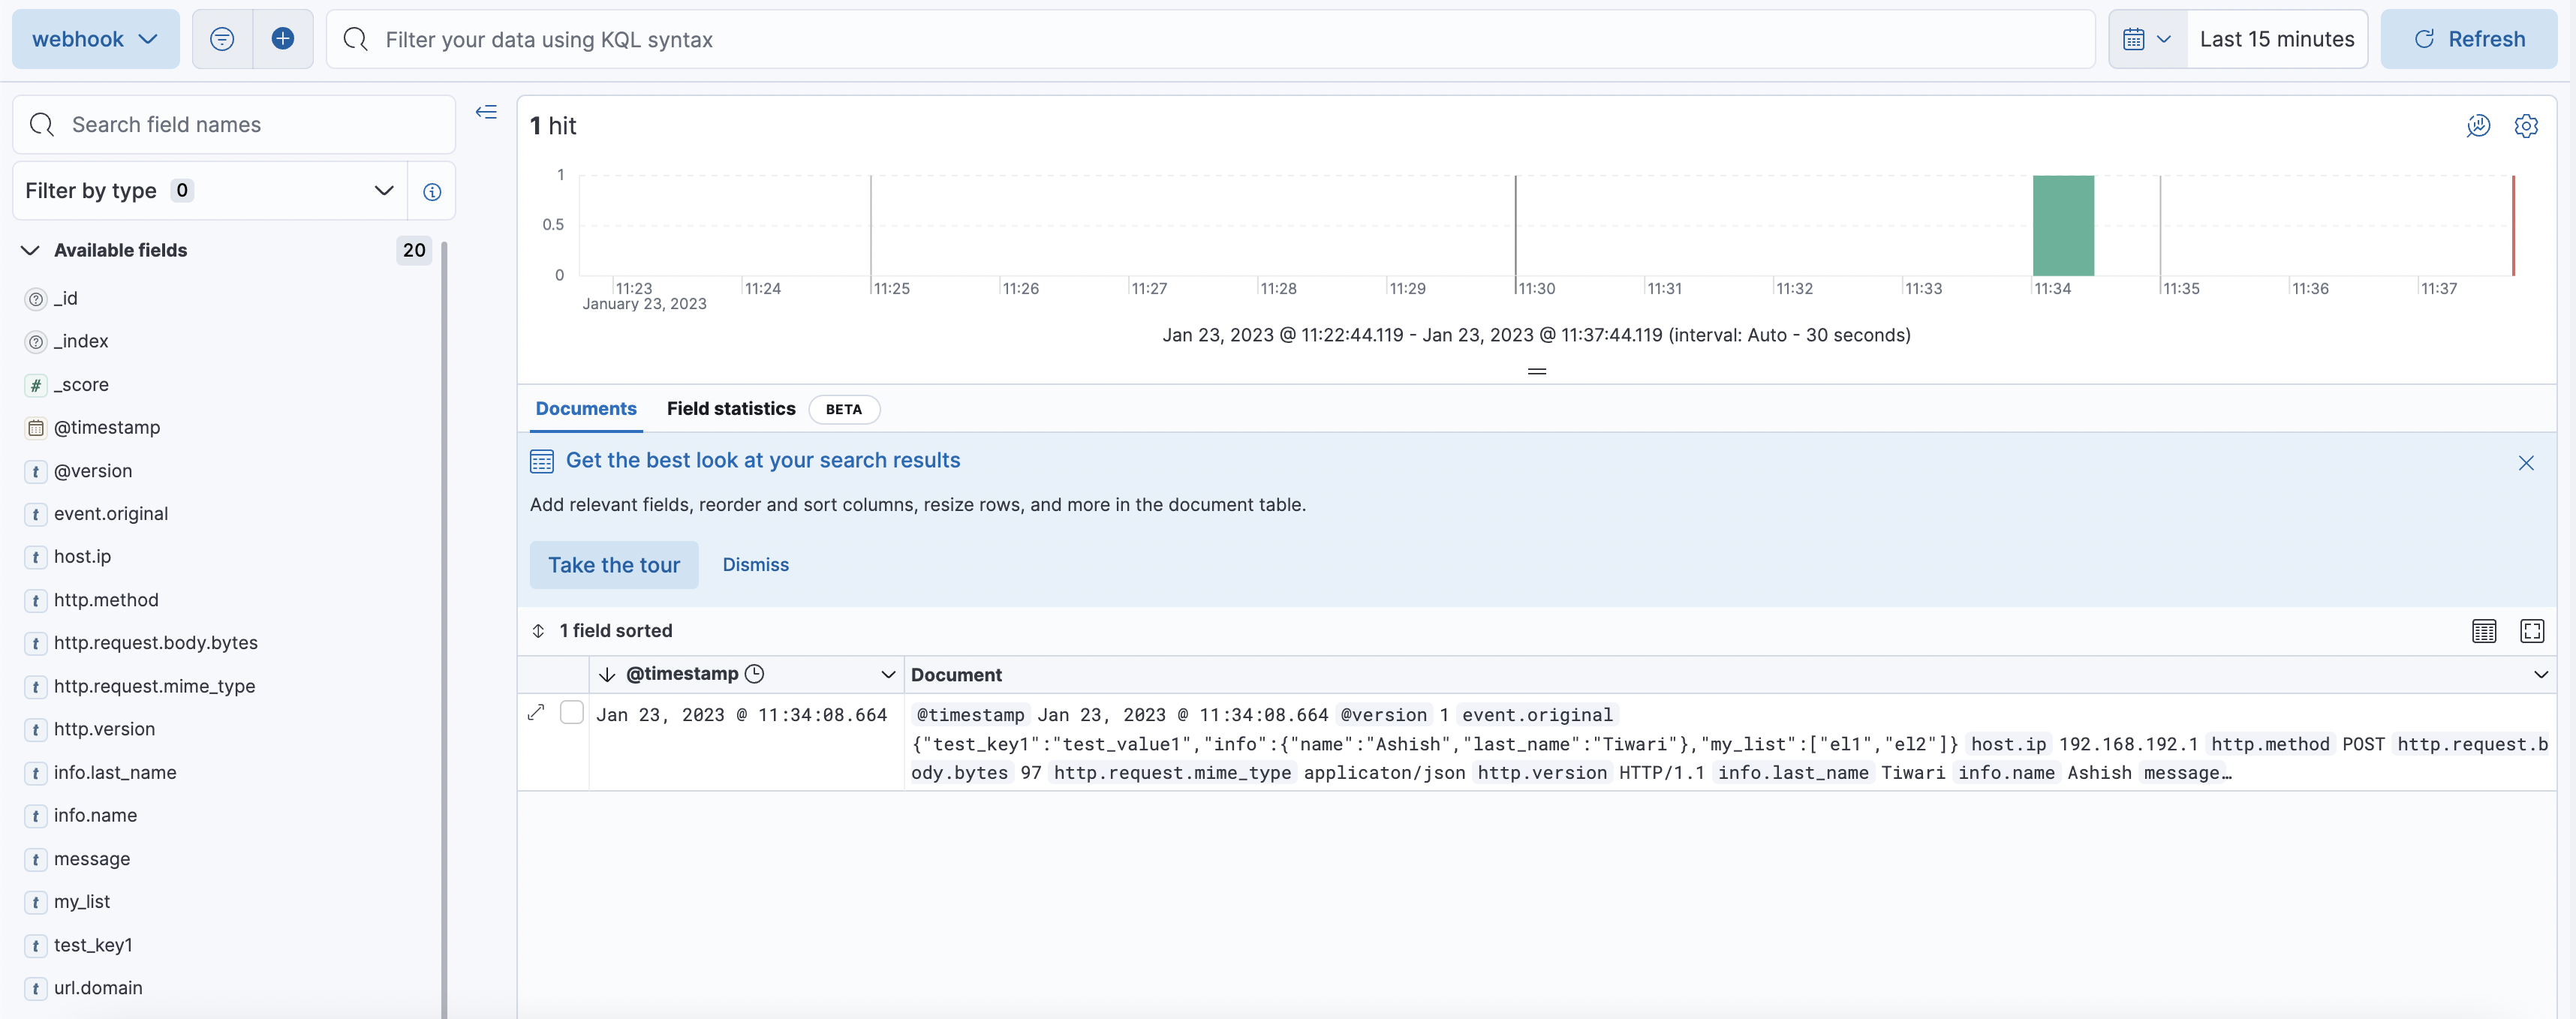
Simply navigate to Menu -> Analytics -> Discover
Create a Data View on the index webhook.
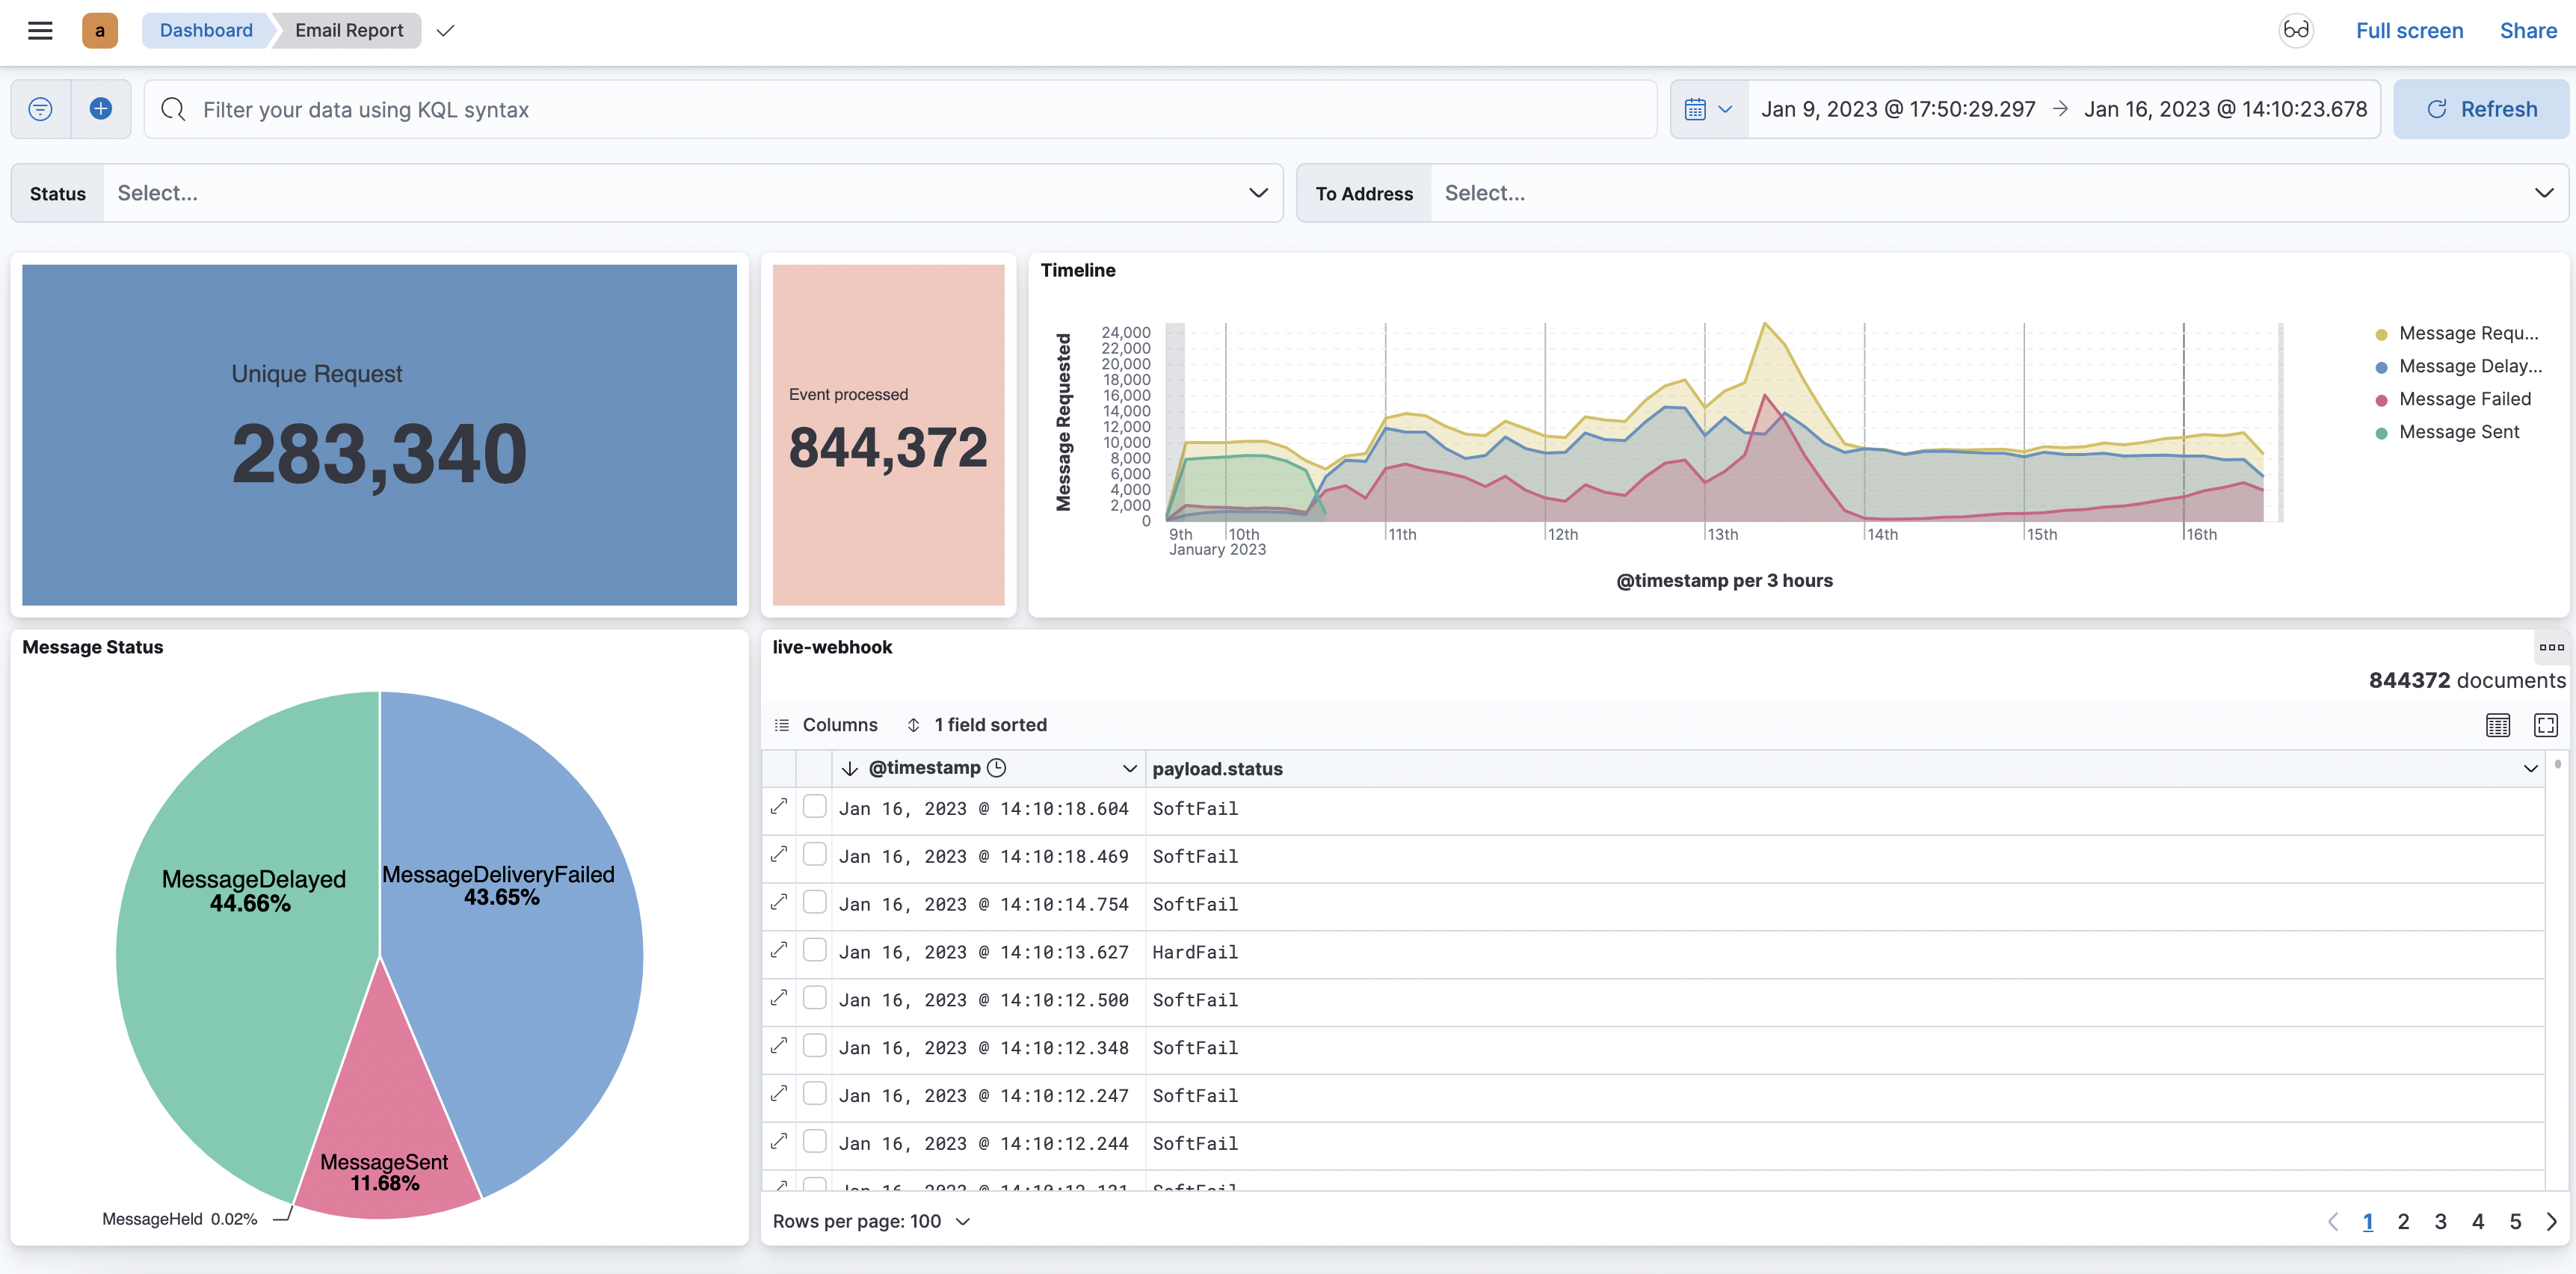
To create the dashboard, go to Menu -> Analytics -> Dashboard. You can create a dashboard according to your requirement.
Conclusion
We have successfully set up the webhook receiver with the help of ELK stack. Though ELK use cases are very vast. There are various input and output plugins available in logstash for data pipelines.